
Change in Impervious Surfaces and its Impact on Humidity and Atmospheric Temperature
-
Pussella Gamaathi Ralalage Naleen Indika Pussella

Department of Remote Sensing and GIS, Faculty of Geomatics, Sabaragamuwa University of Sri Lanka, P.O. Box 02, Belihuloya, Sri Lanka
Ranepura Hewage Hansani Malie WeerasiriDepartment of Remote Sensing and GIS, Faculty of Geomatics, Sabaragamuwa University of Sri Lanka, P.O. Box 02, Belihuloya, Sri Lanka
| Received 27 Nov, 2025 |
Accepted 25 Jan, 2026 |
Published 31 Mar, 2026 |
Background and Objective: Impervious surfaces are, mainly, artificial structures that are covered by water-resistant materials such as paved roads, roofs, residential rooftops and walkways. Accelerated urbanization has converted natural areas into impervious surfaces at an alarming rate everywhere in the world. The result of this trend is very harmful to the environment as well as the well-being of humans. Therefore, this study attempts to analyze the increase of impervious surfaces in the Western Province of Sri Lanka which can be considered as a metropolitan area in the country. Materials and Methods: This study analyses the impact of changes in the land surface on atmospheric temperature and relative humidity. For this study, Landsat images were used taken in the years 2000, 2005, 2009, 2015 and 2021. And these images were classified using the supervised classification technique based on the threshold values, which were calculated using 500 ground sample points. Atmospheric temperature and relative humidity maps were prepared using the data from the Meteorological Department of Sri Lanka. Statistical methods such as correlation analysis method was employed to assess the relationship between the factors. Results: The atmospheric temperature has a correlation coefficient more than +0.7 for all the years (+0.7302 in 2000, +0.7994 in 2005, +0.7504 in 2009, +0.7799 in 2015 and +0.7244 in 2021) and it indicates that the relationship is strong positively in between the factors. Also, it can be identified that the relative humidity has a strong negative correlation with the impervious surfaces (-0.6485 in 2000, -0.7847 in 2005, -0.7025 in 2009, -0.7368 in 2015 and -0.79436 in 2021. Conclusion: Increasing temperature and decreasing relative humidity have a significant influence on environmental changes and climate changes and it is a threat to the health of living organisms and their existence. Therefore, environmentalists and urban planners should consider the remaining open spaces for better ecological conditions.
INTRODUCTION
Impervious surfaces are known as surfaces covered by water-resistant materials such as concrete, brick, asphalt, rooftops, parking areas, driveways, streets, sidewalks, etc.1,2. These structures do not allow rainwater to infiltrate into the ground effectively and efficiently3. Accelerated urbanization is thoroughly responsible for this phenomenon of converting natural areas into impervious surfaces, causing significant influence on the environment. Impervious surfaces increase the air temperature and soil temperature and, at the same time, decrease the relative humidity of the air and the soil volumetric moisture content of the environment4-6
Changes in temperature and relative humidity significantly influence to environmental changes and climate changes and it is a big threat to the health of living beings and their existence7,8. During the daytime, heat directed into the impervious surface areas is absorbed by the impervious surfaces. And then, this energy will re-radiate in the night, mostly, since there is no other way to release the stored heat into the environment. As a result, daytime and nighttime temperatures in the atmosphere will be increased significantly. It is clear that this situation of temperature migration, also known as heat migration, is significantly impacting human health by raising the possibility of heat-related fatalities. This increasing temperature changes the pattern of rainfall and the intensity of rainfall9. It influences highly on agriculture. Also, unnecessary and not-required higher temperature values reduce the quality of the cultivation at an alarming rate10. Further, impervious surfaces negatively influence urban plant growth and wildlife11. The sea level rising can be considered as another harmful impact of temperature rising which increases the ice melting rate, especially in the Arctic Region12.
Humidity changes due to the increasing impervious surfaces’ significant influence on the environment, humans, living things and each other5. As a result of heat migration, the humidity can be dropped which affects badly human health, since humid conditions can disrupt the temperature regulation system in the human body13. The high temperature associated with humidity slows down the evaporative cooling process of the body, resulting in extremely uncomfortable living conditions due to heat exhaustion and leading to heat stroke or even death14. Perspiration evaporates more slowly, making it difficult for human bodies to cool down, causing them to become stressed and over-exercised. Humidity changes, when paired with high temperatures, can produce dehydration, weariness, muscular cramps and fainting15. Therefore, for a comfortable living, a certain amount of humidity is important. People who have bronchial constriction, rhinitis, or other symptoms associated with colds and the flu will see a direct impact from relative humidity on their mucous membranes. The incidence of allergies and respiratory illnesses can be influenced by relative humidity14. Newly born kids and children are more sensitive to humidity than adults. They become less adept at adjusting to environmental changes as a result, leaving them more susceptible to dehydration, weariness, heat exhaustion and other conditions than adults. Asthma, pneumonia, mumps, gastroenteritis and other pediatric disorders are among the infectious and other pediatric diseases that are more likely to occur in children with an undeveloped immune system15.
Additionally, as a result of rapid urbanization and its consequences, impervious surfaces have been rapidly growing and developing, especially in the metropolitan areas in developing countries16. Therefore, analysis of changes in impervious surfaces and their effects on humidity and atmospheric temperature is highly needed to manage the situation. With the understanding of the current situation, the main objective of this study was to find the relationship between the impervious surfaces, relative humidity and atmospheric temperature. The study was mainly a case study for the Western Province of Sri Lanka. The Western Province is the most urbanized core area of the country and it has a number of urban centers within the city limits as well as the surrounding area14.
The relative humidity has a direct impact on the size of the colonies of allergic mites and fungi indoors. The rate of formaldehyde off-gassing from interior construction materials, the pace of acid and salt creation from sulfur and nitrogen dioxide and the rate of ozone generation are all influenced by relative humidity14. Humidity encourages biological organisms, including bacteria, viruses, fungi (mould) and dust mites to appear, grow and spread. It also severely affects garments and any fabric by delaying the drying process. Mold and odor may develop as a result of the clothing’s fibers collecting moisture. Dust mites
thrive in humid settings, such as those found in carpets and beds15. This study aims to examine the changes in impervious surface areas and evaluate their impact on humidity and atmospheric temperature, to understand how urbanization influences local microclimatic conditions.
MATERIALS AND METHODS
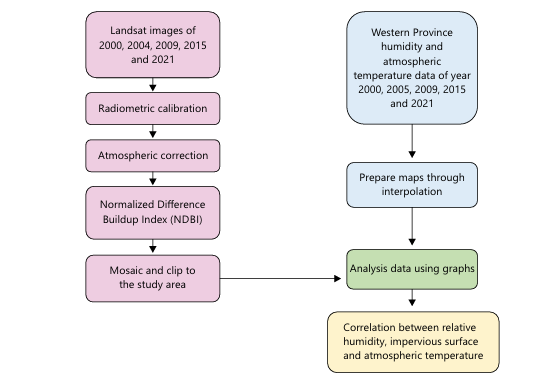
To achieve the specific objectives of the study, satellite images taken in different years were taken into consideration as the main data set. Satellite images can be considered one of the most reliable sources for investigating the temporal changes in impervious surfaces17. In this, Landsat images taken in January, February and March in the years 2000, 2005, 2009, 2015 and 2021 were downloaded from the United States Geological Survey (USGS) Earth Explorer website18. In selecting the cloud-free images from the master database, firstly, similar months were considered. Multi-spectral satellite images were used to estimate impervious surfaces in the Western Province area. The pre-processing part for radiometric and atmospheric corrections was done for all downloaded satellite images using ENVI (version 5.6) software to enhance the quality of the image (Fig. 1).
The imperviousness of images was investigated using the Normalized Difference Built-up Index (NDBI) approach. It describes the built-up density of any Geographic area. The NDBI is calculated as a ratio between the short-wave infrared and near-infrared17. The range of NDBI is from -1 to +1. In this study, NDBI values were calculated using a raster calculator tool in Geographical Information Systems (GIS) (9.3 version) software package. A satellite image mosaic was conducted in order to get a quick overview. After the mosaic, the entire satellite images were clipped into the study area of the Western Province of Sri Lanka.
| Table 1: | Accuracy assessment for the classification of Landsat images from 2000 to 2021 with percentages | |||
| Accuracy assessment | 2000 | 2005 | 2009 | 2015 | 2021 | |
| Producer’s accuracy | Impervious surface | 89.32% | 88.04% | 88.55% | 94.06% | 91.73% |
| Non-impervious surface | 90.19% | 87.66% | 88.25% | 93.45% | 92.07% | |
| User’s accuracy | Impervious surface | 90.30% | 87.60% | 88.20% | 93.40% | 92.10% |
| Non-impervious surface | 89.20% | 88.10% | 88.60% | 94.10% | 91.70% | |
| Overall accuracy | 89.75% | 87.85% | 88.40% | 93.75% | 91.50% | |
| Kappa coefficient | 79.50% | 75.70% | 76.80% | 87.50% | 83.80% |
|
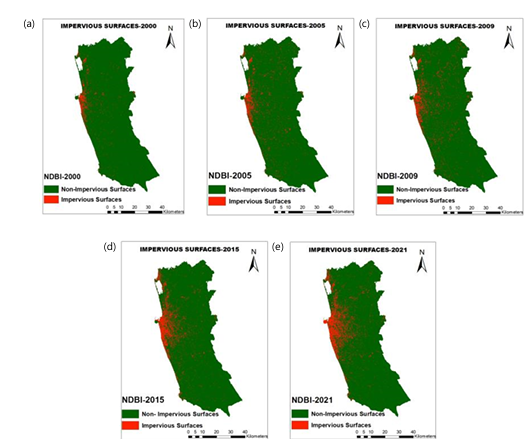
Threshold values were calculated for each year to categorize areas as impervious and non-impervious surfaces using 500 Ground Control Points (GCPs) on a Google Earth Image. The accuracy of this classification was assessed using another 200 points marked on a Google Earth image. Since the overall accuracy of all the images was good enough as expected, further analysis was conducted in the study (Table 1). As a result of this classification, Impervious surface area maps were produced for the years of 2000 (Fig. 2 (a)), 2005 (Fig. 2(b)), 2009 (Fig. 2(c)), 2015 (Fig. 2(d)) and 2021 (Fig. 2(e)).
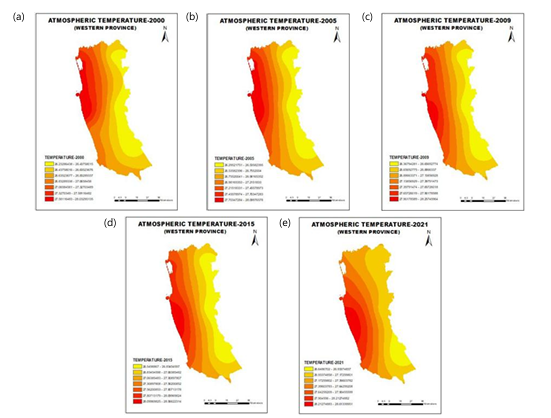
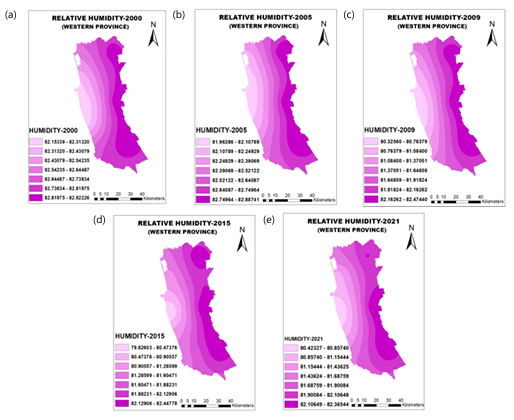
Atmospheric temperature and relative humidity data of the study area for the years 2000, 2005, 2009, 2015 and 2021 were collected from 10 meteorological stations, which were established by the meteorological department and the Central Environmental Authority of Sri Lanka. The kriging method of interpolation in GIS approach was used to prepare the distribution of atmospheric temperature maps for the year 2000 (Fig. 3(a)), 2005 (Fig. 3(b)), 2009 (Fig. 3(c)), 2015 (Fig. 3(d)) and 2021 (Fig. 3(e)) and relative humidity maps for the years of 2000 (Fig. 4(a)), 2005 (Fig. 4(b)), 2009 (Fig. 4(c)), 2015 (Fig. 4(d)) and 2021 (Fig. 4(e)) for the study area, since the calculation part of it gives a greater weight to the points that are close to the location of interest than to those that are further away.
Finally, the relationship between variables was checked and calculated using 100 points selected randomly to find the correlation between them. The statistical concept of correlation describes how closely two variables move in tandem with one another. The two variables are considered to have a positive correlation if they move in the same direction. If they move in opposite directions, then there is a negative correlation between those two variables. Finally, Pearson’s Correlation Coefficients were obtained to check the strength of the relationship between variables. It is a linear correlation coefficient that returns a value of between (-1) and (+1). (-1) means there is a strong negative correlation and (+1) means that there is a strong positive correlation. (0) means that there is no correlation (this is also called zero correlation). Also, if the value is +0.70 or higher, it indicates that there is a very strong positive or negative relationship between the two variables. If it is between +0.40 and +0.69 and -0.40 and -0.69, the relationship is strong positive and negative, respectively.
|
|
|
|
RESULTS AND DISCUSSION
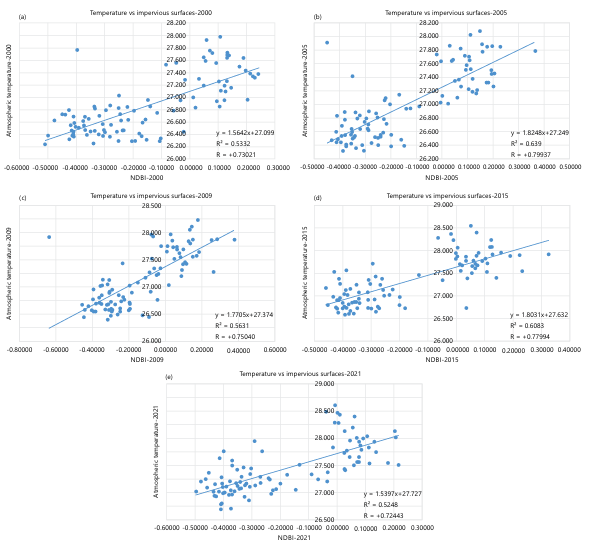
Firstly, the relationship between the atmospheric temperature and the presence of impervious surfaces separately for the given time periods using the correlation coefficient values, was investigated. In this, two variables were plotted on a scatter diagram taking the X axis as the atmospheric temperature and the Y axis as the NDBI value for different years. Figure 5 showed that how atmospheric temperature behaves with impervious surfaces and values for the correlation coefficient.
According to the statistical analysis of this study, it is clear that the relationship between atmospheric temperature and impervious surface coverage is very strong (Fig. 5). In 2000, the correlation coefficient was 0.7302 (Fig. 5(a)) and 0.7994 in 2005 (Fig. 5(b)). Further, in 2009, the coefficient value was 0.7504 (Fig. 5(c)) and the value in 2015 and 2021 were recorded as 0.7799 (Fig. 5(d)) and 0.7244 (Fig. 5(e)) respectively. In summary, since all these values were more than 0.7, it can be concluded that the relationship between atmospheric temperature and the presence of impervious surface coverage is highly correlated positively.
|
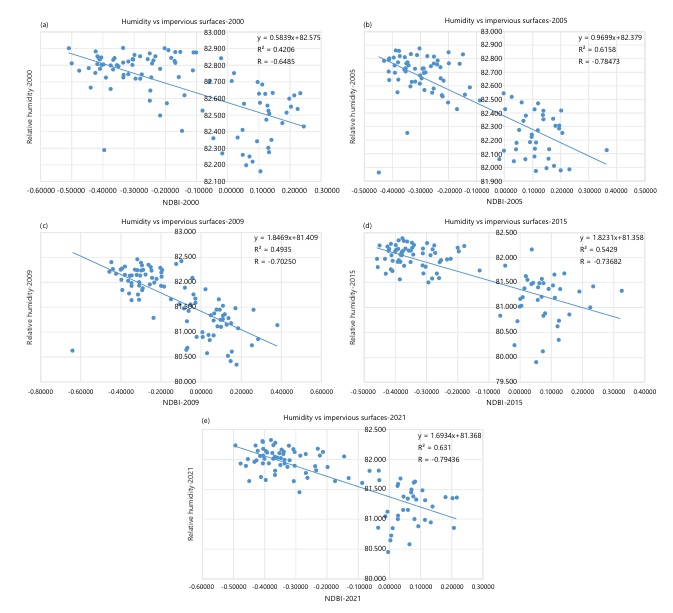
This positive correlation means the atmospheric temperature increases when the impervious surface area increases. This result showed that changes in the impervious surface area coverage strongly affect the atmospheric temperature. Secondly, the study attempted to identify the relationship between the relative humidity and the coverage of impervious surface area for the study area. The correlation coefficient between these variables was (-0.6485) in 2000 (Fig. 6(a)) and (-0.7847) in 2005 (Fig. 6(b)). And, the statistical analysis found that the correlation between the two variables is (-0.7025) in 2009 (Fig. 6(c)). However, the values were (-0.7368) and (-0.79436) for 2015 (Fig. 6(d)) and 2021 (Fig. 6(e)) respectively. Since all these values are greater than 0.7 and negative in nature, it can be concluded that there is a strong relationship between the relative humidity and impervious surface coverage.
Therefore, these results showed that relative humidity always builds a strong negative correlation with impervious surfaces. A negative, or inverse correlation between two variables, indicates that one variable increase while the other decreases, so these negative correlations tell us when impervious surface area increased, relative humidity getting decreased. These results showed that impervious surface changes strongly affect the relative humidity also. Land surface changes difference noticeably affect the atmospheric temperature and relative humidity. The atmospheric temperature always builds a strong positive correlation with NDBI. Relative humidity always builds a strong negative correlation with NDBI.
It means impervious surfaces increased the air temperature and decreased the relative humidity of air (RH) in the environment. Increasing temperature and decreasing relative humidity is a significant influence on environmental changes and climate change and it is a threat to human and organism’s health and their existence.
Qiquan et al.19 and Hidalgo-García and Arco-Díaz20 proved this strong relationship between impervious surfaces and meteorological factors. Xu21 proved that there is a positive exponential relationship between impervious surface and LST. Further, Xu21 mentioned that impervious surfaces accelerate the LST of the area. Zhang et al.22 obtained a weaker correlation between NDVI and LST and a strong positive correlation between NDBI and LST. The impact of the impervious surface reduction was greatly discussed by Yang et al.23 and statistically proved this relationship.
Increasing temperature and decreasing relative humidity is significant influences on environmental change and climate change and it is a threat to human and organisms’ health and their existence. Urbanization is necessary for the world to cater to the rapidly growing population for their living standards. But the side effects of impervious surfaces are very dangerous. Day by day the earth has become an urban planet. Urban and suburban growth is inevitable. But should limit impervious areas. Actions should be taken to control this impact. The government should establish new land use ordinances and regulations for town and country planning. Impervious materials are not the only option for creating surfaces. Alternative surfaces can be used for that. It can reduce the length and width of driveways, the size of parking spaces and other pavements. Also, previous pavement materials can be used wherever feasible.
In getting the results for the study, it was identified several limitations. Firstly, the accuracy of the data set can be the considered as the main limitation. The current study used Landsat satellite images to map the impervious surfaces of the study area. However, the spatial resolution of these images was 30 m. As a result, impervious surfaces smaller than the pixel size were not be identified as impervious surfaces. Therefore, the study highly recommends using high-resolution images and maps or use sub pixel classification techniques in order to prepare the maps. Another related limitation was the data on meteorological factors. These data have been collected by the meteorological department of Sri Lanka for a limited number of stations in the area. There were only 12 meteorological stations covering the area and the relevant maps were prepared using the interpolation technique. However, the study suggests working with a greater number of data collecting stations to get better results.
The study suggested that the government and decision-makers should be involved in this problem. Many of the impacts of impervious surfaces on the atmosphere can be prevented or managed. Working together, local governments and citizens can reduce the amount of land rendered impervious. If there is a will to save the urban areas, there are ways to do it. Therefore, it needs to introduce some actions to control this impact. The government should establish new land use ordinances and regulations for town and country planning. Alternative surfaces can be used instead of it. Further, the length and width of driveways, size of parking spaces and other pavements can be reduced as a recommendation and it can use previous pavement materials wherever feasible.
CONCLUSION
According to the result of this research work, atmospheric temperature has a strong positive correlation with impervious surfaces and relative humidity has a strong negative correlation with impervious surface coverage. Then it can be concluded that impervious surfaces are responsible for increasing air temperature and decreasing relative humidity of the environment. Accelerated urbanization is converting natural areas into impervious surfaces rapidly. Therefore, increasing impervious surfaces make environmental changes much more dire. A half-degree temperature and humidity change can be considered a big impact on the world. Increasing temperature and decreasing relative humidity are significant influences to environmental changes and climate changes and it is a threat to human and organisms’ health and their existence.
Urbanization is necessary for the world to cater to the rapidly growing population for their living standards. But the side effects of impervious surfaces are very dangerous. Day by day the earth has become an urban planet. Urban and suburban growth is inevitable. But should limit the impervious area. Actions should be taken to control this impact. The government should establish new land use ordinances and regulations for the town and country planning. Impervious materials are not the only option for creating surfaces. Alternative surfaces can be used for that. It can reduce the length and width of drive ways, size of parking spaces and other pavements. Also, pervious pavement materials can be used wherever feasible.
The study suggested to the government and decision makers to involve in this problem. Many of the impacts of impervious surfaces on the atmosphere can be prevented or managed. Working together, local governments and citizens can reduce the amount of land rendered impervious. If there is a will to save the urban areas, there are ways to do it. This research work recommends that the environmentalists and urban planners should consider the remaining open spaces for a better ecological condition.
SIGNIFICANCE STATEMENT
Colombo city is a rapidly growing metropolitan area in Sri Lanka and, as a result, a number of construction projects are going on. Therefore, it is necessary to identify the present situation of the city and it has not conducted any detailed analysis for the city in terms of the impervious surfaces and their impacts on humidity and atmospheric temperature. This study was conducted to find the relationship between these factors using GIS and remote sensing techniques. The results of the study show that relative humidity and atmospheric temperature always build a strong negative correlation and a strong positive correlation with impervious surfaces respectively. These results are very important, specially, for urban planning and other related urban studies of Colombo, Sri Lanka. The study further recommends to analyze these impacts with other environmental phenomena to find the real impact of change of impervious surface within the study area.
This study discovered the spatio-temporal relationship between impervious surface expansion and changes in atmospheric temperature and relative humidity, which can be beneficial for urban planners, environmental managers and climate adaptation strategies. The findings provide empirical evidence for metropolitan land-use planning under rapid urbanization. This study will help the researchers to uncover the critical areas of urban-climate interaction that many researchers were not able to explore. Thus, a new theory on impervious-surface-driven microclimatic change may be arrived at.
- Arnold, Jr., C.L. and C.J. Gibbons, 1996. Impervious surface coverage: The emergence of a key environmental indicator. J. Am. Plann. Assoc., 62: 243-258.
- Artis, D.A. and W.H. Carnahan, 1982. Survey of emissivity variability in thermography of urban areas. Remote Sens. Environ., 12: 313-329.
- Bengston, D.N., R.S. Potts, D.P. Fan and E.G. Goetz, 2005. An analysis of the public discourse about urban sprawl in the United States: Monitoring concern about a major threat to forests. For. Policy Econ., 7: 745-756.
- Slonecker, E.T., D.B. Jennings and D. Garofalo, 2001. Remote sensing of impervious surfaces: A review. Remote Sens. Rev., 20: 227-255.
- Song, Y., F. Li, X. Wang, C. Xu, J. Zhang, X. Liu and H. Zhang, 2015. The effects of urban impervious surfaces on eco-physiological characteristics of Ginkgo biloba: A case study from Beijing, China. Urban For. Urban Greening, 14: 1102-1109.
- Baker, M.E., M.L. Schley and J.O. Sexton, 2019. Impacts of expanding impervious surface on specific conductance in urbanizing streams. Water Resour. Res., 55: 6482-6498.
- Xiao, R.B., Z.Y. Ouyang, H. Zheng, W.F. Li, E.W. Schienke and X.K. Wang, 2007. Spatial pattern of impervious surfaces and their impacts on land surface temperature in Beijing, China. J. Environ. Sci., 19: 250-256.
- Zhou, W., G. Huang and M.L. Cadenasso, 2011. Does spatial configuration matter? Understanding the effects of land cover pattern on land surface temperature in urban landscapes. Landscape Urban Plann., 102: 54-63.
- Song, X.P., J.O. Sexton, C. Huang, S. Channan and J.R. Townshend, 2016. Characterizing the magnitude, timing and duration of urban growth from time series of Landsat-based estimates of impervious cover. Remote Sens. Environ., 175: 1-13.
- Zhang, X., T. Zhong, X. Feng and K. Wang, 2009. Estimation of the relationship between vegetation patches and urban land surface temperature with remote sensing. Int. J. Remote Sens., 30: 2105-2118.
- Xian, G., M. Crane and J. Su, 2007. An analysis of urban development and its environmental impact on the Tampa Bay watershed. J. Environ. Manage., 85: 965-976.
- Hope, A., R. Engstrom and D. Stow, 2005. Relationship between AVHRR surface temperature and NDVI in Arctic tundra ecosystems. Int. J. Remote Sens., 26: 1771-1776.
- Liu, L. and Y. Zhang, 2011. Urban heat island analysis using the Landsat TM data and ASTER data: A case study in Hong Kong. Remote Sens., 3: 1535-1552.
- Arundel, A.V., E.M. Sterling, J.H. Biggin and T.D. Sterling, 1986. Indirect health effects of relative humidity in indoor environments. Environ. Health Perspect., 65: 351-361.
- Sy, S. and B. Quesada, 2020. Anthropogenic land cover change impact on climate extremes during the 21st century. Environ. Res. Lett., 15.
- Meiyappan, P. and A.K. Jain, 2012. Three distinct global estimates of historical land-cover change and land-use conversions for over 200 years. Front. Earth Sci., 6: 122-139.
- Lu, D. and Q. Weng, 2006. Use of impervious surface in urban land-use classification. Remote Sens. Environ., 102: 146-160.
- Emmanuel, R., 2005. Thermal comfort implications of urbanization in a warm-humid city: The Colombo Metropolitan Region (CMR), Sri Lanka. Build. Environ., 40: 1591-1601.
- Yang, Q., X. Huang, J. Yang and Y. Liu, 2021. The relationship between land surface temperature and artificial impervious surface fraction in 682 global cities: Spatiotemporal variations and drivers. Environ. Res. Lett., 16.
- Hidalgo-García, D. and J. Arco-Díaz, 2023. Spatiotemporal analysis of the surface urban heat island (SUHI), air pollution and disease pattern: An applied study on the city of Granada (Spain). Environ. Sci. Pollut. Res., 30: 57617-57637.
- Xu, H., 2010. Analysis of impervious surface and its impact on urban heat environment using the normalized difference impervious surface index (NDISI). Photogramm. Eng. Remote Sens., 76: 557-565.
- Zhang, Y., I.O.A. Odeh and C. Han, 2009. Bi-temporal characterization of land surface temperature in relation to impervious surface area, NDVI and NDBI, using a sub-pixel image analysis. Int. J. Appl. Earth Obs. Geoinf., 11: 256-264.
- Yang, L., S. Zhang, L. Yin and B. Zhang, 2022. Global occupation of wetland by artificial impervious surface area expansion and its impact on ecosystem service value for 2001-2018. Ecol. Indic., 142.
How to Cite this paper?
APA-7 Style
Naleen Indika Pussella,
P.G., Malie Weerasiri,
R.H. (2026). Change in Impervious Surfaces and its Impact on Humidity and Atmospheric Temperature. Asian Science Bulletin, 4(1), 1-10. https://doi.org/10.21124/asb.2025.01.10
ACS Style
Naleen Indika Pussella,
P.G.; Malie Weerasiri,
R.H. Change in Impervious Surfaces and its Impact on Humidity and Atmospheric Temperature. Asian Sci. Bul 2026, 4, 1-10. https://doi.org/10.21124/asb.2025.01.10
AMA Style
Naleen Indika Pussella
PG, Malie Weerasiri
RH. Change in Impervious Surfaces and its Impact on Humidity and Atmospheric Temperature. Asian Science Bulletin. 2026; 4(1): 1-10. https://doi.org/10.21124/asb.2025.01.10
Chicago/Turabian Style
Naleen Indika Pussella, Pussella, Gamaathi Ralalage, and Ranepura Hewage Hansani Malie Weerasiri.
2026. "Change in Impervious Surfaces and its Impact on Humidity and Atmospheric Temperature" Asian Science Bulletin 4, no. 1: 1-10. https://doi.org/10.21124/asb.2025.01.10

This work is licensed under a Creative Commons Attribution 4.0 International License.