
Evaluation of Different Diagnostic Strategies in the Assessment and Management of Metabolic Syndrome Patients in South, Nigeria
-
Dorathy Chioma Okpokam


Department of Haematology and Blood Transfusion Science, University of Calabar, Calabar, Nigeria
Daniel Lotachukwu MuokaDepartment of Haematology and Blood Transfusion Science, University of Calabar, Calabar, Nigeria
Mbang Kooffreh-AdaDepartment of Internal Medicine, University of Calabar Teaching Hospital, Calabar, Nigeria
Idongesit IsongDepartment of Clinical Chemistry and Immunology, University of Calabar, Calabar, Nigeria
Ogha Eyamnzie OkpokamEpidemiology and Public Health, Achieving Health Nigeria Initiative (AHNi), Ikom, Nigeria
Henry Afamefuna EfobiDepartment of Chemical Pathology, University of Calabar Teaching Hospital, Calabar, NGA
| Received 07 Nov, 2023 |
Accepted 08 Apr, 2024 |
Published 31 Dec, 2024 |
Background and Objective: Metabolic syndrome (Mets), characterized by frequent co-occurrence of obesity, high blood pressure, abnormal lipid levels and insulin resistance, demonstrates a higher likelihood than random chance and exhibits a notable genetic influence. It is a huge public health problem worldwide that is responsible for a growing number of premature deaths throughout the world. The study aims to investigate the levels of serum ferritin (SF), fibrinogen (FIB) and some Liver Function Tests (LFT) among metabolic syndrome patients in UCTH (University of Calabar Teaching Hospital). Materials and Methods: A total number of 120 subjects (60 controls and 60 tests) were selected. The SF, FIB and LFT testing were done using ELISA, dry weight clot method and colorimetric method, respectively. The result was presented in tables and graphs±SD and was obtained using student’s t-test, ANOVA and Pearson’s correlation. Results: The highest percentage age range was 40-52 (42%), female subjects (52%) and married individuals (90%). Mets patient test subjects had higher mean values of the parameters than the control and were statistically significant (p<0.001). Males had higher levels of the parameters in contrast to females who had lower levels with the exception of FIB. The age range of Mets patients’, showed an increase in SF level as they got older and this was statistically significant (p<0.05). The AST and ALT also showed a decrease in the level as the age range increased and was statistically significant (p<0.05). Conclusion: This study suggests that SF, FIB alongside AST and ALT should be included in a panel of tests for diagnosis of Mets in the hospitals for better assessment and management of patients.
INTRODUCTION
Metabolic syndrome is a collection of interrelated health issues that often coexist, raising the chances of heart ailments, stroke and type II diabetes. This complex involves risk elements contributing to coronary heart disease, diabetes, fatty liver and various types of cancers. It comprises risk factors for coronary heart disease, diabetes, fatty liver and several cancers. These conditions include increased high blood pressure of (130 mmHg systolic and 85 mmHg diastolic or higher), high blood sugar of (100 mg/dL or higher), excess body fat around the waist of (more than 40 inches for males and more than 35 inches for females), reduced high density lipoprotein cholesterol of (less than 40 mg/dL in men and less than 50 mg/dL in female) and abnormal triglyceride levels of (150 mg/dL or greater). Metabolic syndrome is closely linked to obesity or overweight and inactivity and is also linked to a condition called insulin resistance1.
Ferritin is a universal intracellular protein that stores iron and releases it in a controlled fashion. It is found in most tissues as a cytosolic protein, but small amounts are secreted into the serum where it functions as an iron carrier. It has been suggested that an increase in iron or ferritin levels catalyzes the formation of hydroxyl radicals, which contribute to the development of insulin resistance2. Fibrinogen on the other hand, is a soluble protein that is produced in the liver and released into the bloodstream when tissue or blood vessels are damaged. The coagulation cascade initiated by platelet and other clotting factors is activated at the site as needed one after another. At the end of the cascade, fibrinogen is converted to fibrin, fibrin is an insoluble protein that forms a threaded mesh over the injury site. Thrombin is the enzyme that activates this conversion. Fibrinogen is used as a follow-up in chronic conditions such as liver disease or any health condition that leads to inflammation such as metabolic syndrome3.
Liver function tests are broad tests useful in the evaluation and treatment of patients with hepatic dysfunction. The liver carries out metabolism of carbohydrates, fat and proteins, some of the enzymes and end products of the metabolic pathway that are very sensitive to the abnormality that occurs may be considered biomarkers of liver dysfunction, which are; serum bilirubin, Alanine Aminotransferase (ALT), Aspartate Aminotransferase (AST), ratio of aminotransferase, alkaline phosphatase, gamma-glutamyl transferase, 5´nucleotidase, ceruloplasmin and α-fetoprotein4. Alanine Aminotransferase (ALT) is found in kidney, heart and muscle and greater concentration in liver compared with other tissues of the body and it is purely cytoplasmic with a normal serum level of 0-40 U/L. Any type of liver cell injury can reasonably increase ALT levels. Aspartate Aminotransferase (AST) is found in high concentration in the heart compared to other tissue of the body and it exits in two forms in the mitochondrial and cytoplasmic form, with normal serum level of 0 to 40 U/L. The AST level elevation predominates in patients with cirrhosis and even in liver disease that typically have an increased ALT5. In some work conducted on people with metabolic syndrome, it was observed that AST and ALT were more than the upper limit of normal likewise gamma-glutamyl transferase.
Recently there has been a prevalence of cases of metabolic syndrome in our locality, although advances in non-invasive biomarkers have improved disease detection and follow-up. There is still considerable work needed to monitor the syndrome in patients to efficiently manage the condition. This study seeks to add its quota and in-depth knowledge and assess the levels of serum ferritin, fibrinogen and some Liver Function Tests (LFT) as possible inflammatory markers for the early diagnosis and good and better management of patients.
MATERIALS AND METHODS
A cross-sectional study design was employed in the study, in which a total of 120 subjects were enrolled. This study took place between February, 2021 to August, 2021. The area chosen for this research to recruit patients was Medicine Outpatient, Family Medicine and Metabolic Clinic of the University of Calabar Teaching Hospital Calabar. The subjects enrolled comprise 60 metabolic syndrome patients and 60 healthy subjects, adult males and females of the age range of between 27 to 65 years old.
The ethical clearance was sought for and obtained from the Health Research Ethical Committees (HREC) of the University of Calabar Teaching Hospital, with the HREC protocol number UCTH/HREC/33/525.
Subjects who had metabolic syndrome, who gave their informed consents and filled out the questionnaire were included in the study. The following vital signs and procedures were carried out; weight, height, waist, hip, waist-to-hip ratio, Body Mass Index (BMI), systolic blood pressure (SBP) and diastolic blood pressure (DBP) to ascertain the condition before the inclusion. Moreover, subjects who did not have metabolic syndrome and who had other medical conditions other than metabolic syndrome were excluded.
Five milliliters of blood were aseptically drawn with minimum static from a prominent vein and 2.25 mL of blood was dispensed into a sample container containing 0.25 mL of 3.31% trisodium citrate for fibrinogen and then spun at 12000 rpm for 15 min to obtain platelet-poor plasma. Then the remaining blood was dispensed into a plain container to harvest serum which was used for serum ferritin estimation and liver function test after spinning for 5 min at 12000 rpm.
Plasma fibrinogen concentration (FIB) was assayed using Ingram’s dry clot weight method6,7. The principle is that fibrinogen in plasma is converted into fibrin by clotting with calcium chloride. The resulting clot is dried and weighed. The result is expressed in g/L.
Reference range = 1.5-4 g/L |
Procedures: Pre-incubate a clean glass tube in a water bath at 37°C. Add 1mL of plasma into the glass tube to allow it to warm up for 1 min. Add 1 mL of pre-warmed calcium chloride (0.025 m CaCl2) and allow it to clot. Incubate the clotted sample in a water bath for 1 hr. Gently wound off the resulting fibrin using a wooden swab stick. Wash the stick and the adherent fibrin in normal saline. Carefully remove the fibrin from the stick and drop it into acetone for 10-15 min to dry. Dry the clot with filter paper. Transfer into a hot oven of 90°C to dry for 3 hrs. Take it to the desiccator to cool down and then weigh it.
Serum ferritin (SF) was tested using Enzyme-Linked Immunosorbent Assay (ELISA), a quantitative test. The solid phase immobilization is composed of rabbit anti-ferritin and mouse monoclonal anti-ferritin is utilized as the antibody-enzyme conjugate solution for this assay system. There is a simultaneous reaction of the test sample with the antibodies resulting in the ferritin molecule being sandwiched between the solid phase and enzyme-linked antibodies.
Incubation is done for 45 min at room temperature after which the wells are washed with water to remove unbound labeled antibodies. A solution of 3,3',5,5'-tetramethylbenzidine (TMB) is added and incubated for 20 min resulting in the development of a blue color. Upon incorporation of 1N HCL, the color formation halts and the subsequent yellow hue is quantified using a spectrophotometer at a wavelength of 450 nm. The concentration of ferritin is directly proportional to the color intensity of the test sample.
Alanine aminotransferase and aspartate aminotransferase were assayed using colorimetric8 method and their principle is that; alanine aminotransferase in the sample catalyzes the reaction of alanine and α-ketoglutarate to pyruvate and glutamic acid, the higher the enzyme activity, the higher the pyruvate. The pyruvate formed reacts with dinitrophenylhydrazone at pH 7.4 to form a brownish coloured hydrazone. The intensity of the colour is directly proportional to the concentration of ALT. Meanwhile, aspartate aminotransferase principle is that it catalyzes the reversible transfer of an amino acid group from aspartate to α-ketoglutarate forming glutamate and oxaloacetate. The oxaloacetate produced is reduced to malate by malate dehydrogenase and NADH. The oxaloacetate reacts with dinitrophenylhydrazine to give a brownish color which is read enzymatically at 546 nm.
Statistical analysis: Data was presented in tables and graphs as±Standard Deviation (SD). The Statistical Package for Social Science (SPSS) 23 was used in the analysis of the results. Comparison was made between two and three groups using Student t-test and ANOVA, respectively. Pearson correlation was also used to determine relationships. The p≤0.05 were considered statistically significant.
RESULTS
Table 1 shows the demographic distribution of the control and metabolic syndrome patients. The age range of both control and metabolic syndrome patients was between 27 and 68 years and they comprised 3 groups which are 27-39, 40-52 and >52 years. It was observed in metabolic patients that the age range group of 40-52 years (42%) had the highest percentage, followed by >52 years (30%), while 27-39 (28%) had the smallest percentage. In gender, the female had the highest percentage (52%) while the male had (48%). The marital status shows that the married group (92%) had the highest percentage while the single and divorced had the smallest percentage of 3 and 5%, respectively. The duration was in three groups, 7 months to 1, 2 years to 4, 5 years and above with the groups showing the same percentage of 33.5%.
Table 2 shows the comparison between vital signs, SF, FIB, FBS, AST and ALT levels of the control group (without metabolic syndrome) and test group (with metabolic syndrome) of the study. The mean values of the parameters (weight, height, waist, hip, waist-hip ratio, body mass index, systolic blood pressure and diastolic blood pressure) for the control group are 72.2 kg, 1.9 m, 34.6 in, 39.9 in, 0.9 ratios, 21.7 kg/m2, 113.8 mmHg, 76.5 mmHg and were found to be statistically significantly lower (p<0.001) than the test group (metabolic syndrome patients) whose mean values are 90.2 kg, 1.7 m, 44.9 in, 44.2 in, 1.02 ratio, 32.7 kg/m2, 175.5 and 102.3 mmHg. Meanwhile, the mean values of the SF, FIB, FBS, AST and ALT from control group are 61.0 ng/mL, 2.0 g/L, 4.7 mmol/dl, 19.3 U/L and 21.4 U/L and were found to also be significantly (p<0.001) dropped than the test group whose mean values (SF, FIB, FBS, AST and ALT) are 190.9 ng/mL, 4.0 g/L, 11.5 mmol/dL, 41.0 U/L and 40.5 U/L.
| Table 1: | Demographic distribution of control and metabolic syndrome patients of the study | |||
| Demographics | Control subjects n = 60 (%) |
Metabolic subjects n = 60 (%) |
| Age range (years) | ||
| 27-39 | 32(53.0) |
17(28.0) |
| 40-52 | 16(27.0) |
25(42.0) |
| 53-68 | 12(20.0) |
18(30.0) |
| Gender | ||
| Male | 29 (48.0) |
29 (48.0) |
| Female | 31 (52.0) |
31 (52.0) |
| Marital status | ||
| Divorced | 3(5.0) |
2(3.0) |
| Married | 51(85.0) |
55(92.0) |
| Single | 6(10.0) |
3 (5.0) |
| Duration | ||
| 7 months to 1 years | 0(0.0) |
20(33.0) |
| 2 to 4 years | 19(33.5) |
|
| 5 years and above | 19(33.5) |
|
| Table 2: | Comparison between vital signs, SF, FIB, FBS, AST and ALT parameters of non-metabolic syndrome (control group) and metabolic syndrome patients | |||
| Parameter | Non-metabolic syndrome n = 60 |
Metabolic syndrome n = 60 |
p value |
| Weight (kg) | 75±1.56 |
90.2±2.34 |
0.001 |
| Height (m) | 1.9±0.02 |
1.7±0.01 |
0.001 |
| Waist (in) | 34.6±0.45 |
44.9±0.58 |
0.001 |
| Hip (in) | 39.9±0.25 |
44.2±0.52 |
0.001 |
| Waist-hip (ratio) | 0.90±0.01 |
1.02±0.01 |
0.001 |
| BMI (kg/m2) | 21.7±0.22 |
32.7±0.82 |
0.001 |
| SBP (mmHg) | 113.8±0.73 |
175.5±4.23 |
0.001 |
| DBP (mmHg) | 76.5±0.54 |
102.3±2.13 |
0.001 |
| SF (ng/mL) | 61.0±3.88 |
190.0±25.31 |
0.001 |
| FIB (g/L) | 2.0±0.06 |
4.0±0.07 |
0.001 |
| FBS (mmol/L) | 4.7±0.05 |
11.5±1.85 |
0.001 |
| AST (U/L) | 19.3±0.32 |
41.0±0.65 |
0.001 |
| ALT (U/L) | 21.4±0.52 |
40.5±0.63 |
0.001 |
| Values are expressed as T-test values p<0.001 are statistically significant, BMI: Body mass index, SBP: Systolic blood pressure, DBP: Diastolic blood pressure, SF: Serum ferritin, FIB: Fibrinogen, FBS: Fasting blood sugar, AST: Aspartate aminotransferase and ALT: Alanine aminotransferase | |||
| Table 3: | Comparison of the vital signs, SF, FIB, FBS, AST and ALT levels of patients with metabolic syndrome based on age | |||
| Parameter | 27-39 years n = 17 |
40-52 years n = 25 |
n = 18 |
p value |
| Weight (kg) | 93.5±3.75 |
88.1±4.68 |
88.4±5.00 |
0.72 |
| Height (m) | 1.6±0.02 |
1.7±0.02 |
1.7±0.87 |
0.136 |
| Waist (in) | 42.9±0.86 |
45.8±1.05 |
45.7±0.84 |
0.82 |
| Hip (in) | 44.1±0.99 |
44.5±0.77 |
43.9±0.94 |
0.89 |
| Waist-hip (ratio) | 1.0±0.22 |
1.0±0.17 |
1.0±0.26 |
0.1 |
| BMI (kg/m2) | 36.1±1.91 |
30.8±1.06 |
32.2±1.24 |
0.337 |
| SBP (mmHg) | 189.2±10.09 |
169.0±6.03 |
171.0±5.29 |
0.124 |
| DBP (mmHg) | 98.5±2.09 |
101.2±4.47 |
106.6±2.79 |
0.383 |
| SF (ng/mL) | 113.9±16.73ab |
173.7±32.6 |
210.0±4.64* |
0.025 |
| FIB (g/L) | 3.9±0.12 |
4.0±0.10 |
4.0±0.11 |
0.833 |
| FBS (mmol/L) | 9.93±0.83 |
9.9±0.59 |
10.9±0.94*ab |
0.019 |
| AST (U/L) | 46.8±2.0ab |
45.9±0.9*b |
40.7±0.7*a |
0.001 |
| ALT (U/L) | 45.8±2.0ab |
44.5±0.9*b |
40.6±0.7*c |
0.001 |
| Values are expressed as one-way ANOVA values, p<0.05 are statistically significant, *Significant from group 1 (27-39 years), aSignificant from group 2 (40-52 years), bSignificant from group 3 (53-68years), BMI: Body mass index, ALT: Alanine aminotransferase, SBP: Systolic blood pressure, DBP: Diastolic blood pressure, SF: Serum ferritin, FIB: Fibrinogen, FBS: Fasting blood sugar and AST: Aspartate aminotransferase | ||||
Table 3 shows the comparison of the vital signs, SF, FIB, FBS, AST and ALT levels of patients with metabolic syndrome based on age. Out of the 60 subjects enrolled in the study, mean value of subjects of age range 27-39 years with vital signs (weight, height, waist, hip, waist-hip ratio, body mass index, systolic blood pressure and diastolic blood pressure) are 93.5 kg, 1.6 m, 42.9 in, 44.1 in, 1.0 ratio, 36.1 kg/m2, 189 and 98.5 mmHg. The mean value of age range 40-52 years is 88.1 kg, 1.7 m, 45.8 in, 44.5 in, 1.0 ratio, 30.8 kg/m2, 169 mmHg, 101.2 mmHg and mean values of age range 53-68 years are 88.1 kg, 1.7 m, 45.2 in, 43.4 in, 1.2 ratio, 32.1 kg/m2, 170 and 106 mmHg). No statistical change was found (p>0.05) among the age group. Moreover, the mean values of subjects for the age range 27-39 years of SF, FBS, AST and ALT (113 ng/mL, 9.93 mmol/dl, 46.8 and 45.8 U/L); mean value of age range 40-52 years (173.72 ng/mL, 8.50 mmol/dL, 45.9 and 44.5 U/L) and mean value of age range 53-68 years (210 ng/mL, 10.9 mmol/dL, 40.7 and 40.6 U/L). Statistical change was found in the age range with the above-listed parameter (p<0.05). There was no significant difference (p>0.05) in FIB of all age range groups in comparison.
| Table 4: | Comparison of vital signs, SF, FIB, FBS, AST and ALT levels of the test group (metabolic syndrome) based on gender | |||
| Parameter | Males n = 29 |
Female n = 31 |
p values |
| Weight (kg) | 88.1±2.2 |
92.9±4.3 |
0.001 |
| Height (m) | 1.7±0.0 |
1.7±0.0 |
0.001 |
| Waist (in) | 45.5±0.6 |
44.6±1.0 |
0.001 |
| Waist-hip (ratio) | 1.1±0.1 |
1.0±0.0 |
0.001 |
| BMI (kg/m2) | 32.0±1.1 |
33.1±1.6 |
0.001 |
| SBP (mmHg) | 170.0±4.6 |
177.6±6.4 |
0.001 |
| DBP (mmHg) | 99.87±2.3 |
101.4±2.0 |
0.001 |
| SF (ng/mL) | 172.5±43.2 |
104.4±12.3 |
0.001 |
| FIB (g/L) | 3.8±0.1 |
4.2±0.14 |
0.001 |
| FBS (mmol/L) | 9.8±3.8 |
13.2±0.7 |
0.001 |
| AST (U/L) | 42.2±1.0 |
40.8±1.0 |
0.001 |
| ALT (U/L) | 41.5±1.0 |
39.5±1.0 |
0.001 |
| Values are expressed as t-test values p<0.001 are statistically significant, BMI: Body mass index, SBP: Systolic blood pressure, DBP: Diastolic blood pressure, SF: Serum ferritin, FIB: Fibrinogen, FBS: Fasting blood sugar, AST: Aspartate aminotransferase and ALT: Alanine aminotransferase | |||
| Table 5: | Comparison of vital signs, SF, FIB, FBS, AST and ALT levels of test group (metabolic syndrome) based on duration | |||
| Parameter | 7 months to 1 year n = 20 |
2 to 4 year n = 19 |
5 years and above n = 19 |
p value |
| Weight (kg) | 92.9±5.9 |
88.5±1.9 |
93.5±15.5 |
0.667 |
| Height(m) | 1.7±0.0 |
1.7±0.2 |
1.7±0.4 |
0.769 |
| Waist(in) | 45.4±1.3 |
45.0±3.7 |
41.0±0.0 |
0.429 |
| Hip(in) | 44.6±1.1 |
44.1±0.6 |
40.0±0.0 |
0.305 |
| Waist-hip (ratio) | 1.0±0.0 |
1.0±0.0 |
1.0±0.0 |
0.998 |
| BMI (kg/m²) | 33.1±1.7 |
32.4±0.9 |
33.5±7.5 |
0.93 |
| SPB (mmHg) | 179.7±8.2 |
173.0±5.1 |
166.5±16.5 |
0.754 |
| DPB (mmHg) | 103.4±2.8 |
101.1±3.0 |
109.0±20.5 |
0.728 |
| SF (ng/mL) | 131.7±13.9 |
174.1±38.6 |
168.9±12.3 |
0.253 |
| FIB (g/L) | 3.3±0.1 |
4.0±0.7 |
4.1±0.2 |
0.107 |
| FBS (mmol/L) | 9.3±0.8 |
10.5±0.6 |
8.6±2.9 |
0.405 |
| AST (U/L) | 42.2±1.3 |
40.4±0.8 |
41.0±0.7 |
0.501 |
| ALT (U/L) | 41. 1±1.6 |
40.1±0.8 |
42.0±2.0 |
0.686 |
| Values are expressed as one-way ANOVA values, p<0.05 are statistically significant, BMI: Body mass index, SBP: Systolic blood pressure, DBP: Diastolic blood pressure, SF: Serum ferritin, FIB: Fibrinogen, FBS: Fasting blood sugar, AST: Aspartate aminotransferase and ALT: Alanine aminotransferase | ||||
Table 4 shows a comparison of vital signs, SF, FIB, FBS, AST and ALT of the test group (metabolic syndrome) based on gender. The mean values of the vital signs (weight, height, waist, hip, waist-hip ratio, BMI, SBP and DBP) are 88.1 kg, 1.7 m, 45.5 in, 42.7 in, 1.1 ratio, 32. kg/m2, 170 mmHg and 99.9 mmHg for male and 92.9 kg, 1.7 m, 44.6 in, 1.0 ratio, 33.1 kg/m2, 177.6 mmHg and 101.4 mmHg for female. There was a statistically significant (p<0.001) increase found in weight, BMI, SBP and DBP and a statistically significant (p<0.001) decrease in waist, waist-hip ratio mean values of females when compared to males. Meanwhile mean values of the male subjects with respect to the SF, FIB, FBS, AST and ALT are 172.5 ng/mL, 3.84 g/L, 9.8 mmol/dl, 42.2U/L and 41.5U/L, while that of the female subjects are 104.4 ng/mL, 4.19 g/L, 13.2 mmol/dl, 40.8 U/L and 39.5 U/L. There was a statistically significant (p<0.001) increase found in SF, FBS, AST and ALT and a statistically significant (p<0.001) decrease in FIB mean value of male when compared with the female.
Table 5 shows a comparison of vital signs, SF, FIB, FBS, AST and ALT levels of the test group (metabolic syndrome) based on duration. The mean value of subjects with a duration of 7 months to 1 year of the following vital signs (weight, height, waist, hip, waist-hip ratio, body mass index, systolic blood pressure and diastolic blood pressure) is 92.9 kg, 1.7 m, 45.4 in, 44.6 in, 1.0 ratio, 33.1 kg/m2, 179.7 and 103 mmHg, 2 to 4 years are 88.5 kg, 1.7 m, 45.0 in, 44.1 in, 1.0 ratio, 32.4 kg/m2, 173 and 101.1 mmHg, 5 years and above are 93.5 kg, 1. 7 m, 41.0 in, 40.0 in, 1.0 ratio, 33.5 kg/m2, 166.5 and 109.5 mmHg. No statistical
change was found (p>0.05) during the time frame. The mean value of subject with duration of 7 months to 1 year as regard to the parameters (SF, FIB, FBS, AST and ALT) are 131.7 ng/mL, 3.3 g/L, 9.3 mmol/dL, 42.2 and 41.1 U/L, 2 to 4 years are 174 ng/mL, 4.0 g/L 10.5 mmol/dL, 40.4 and 40.1 U/L, 5 years and above are 168 ng/mL, 4.1 g/L, 8.6 mmol/dL, 41.0 and 42.0 U/L. No statistical change was also found (p>0.05) during the time frame of the illness.
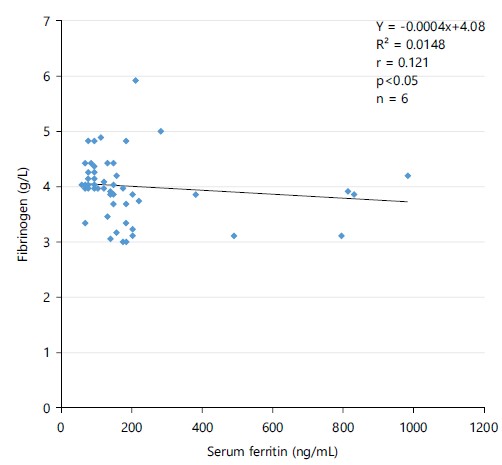
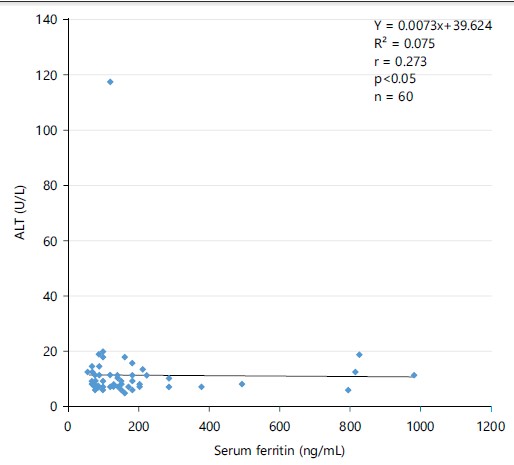
Figure 1 shows an association between SF and FIB in patients with metabolic syndrome, which was a weak significant negative correlation. The weak negative correlation indicates that as FIB increases while SF decreases r = 0.121 (p<0.05). In the association between SF and ALT (Fig. 2), patients with metabolic syndrome show a weak/moderate significant negative correlation (r = 0.273, p<0.05), indicating that as ALT increases SF decreases.
|
|
|
|
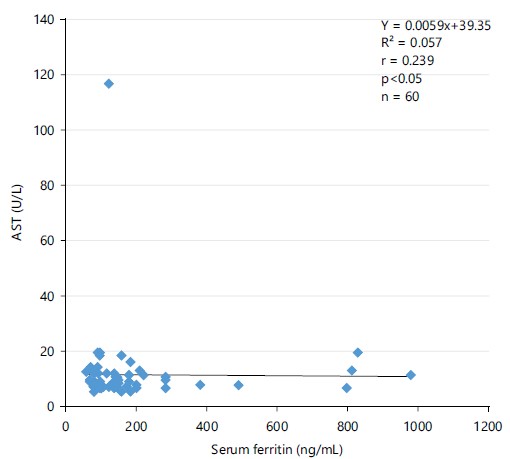
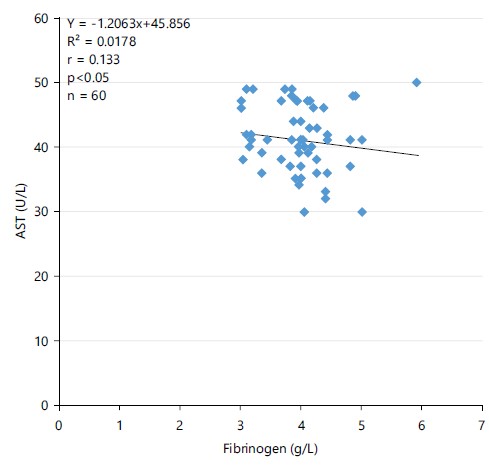
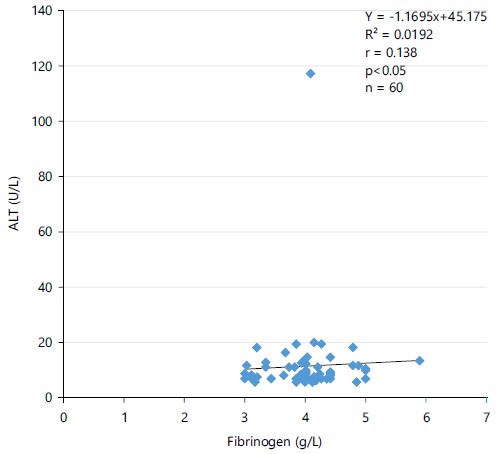
Figure 3 shows an association between SF and AST in patients with metabolic syndrome. It shows weak/moderate significant negative correlation (r = 0. 239, p<0.05). The weak negative correlation indicates that as AST increases serum ferritin decreases. Figure 4 shows an association between FIB and AST in patients with metabolic syndrome. It indicates that AST increases fibrinogen decreases r = 0.133 (p<0.05). An association between fibrinogen and ALT in patients with metabolic syndrome shows a weak positive correlation, which indicates that as ALT increases fibrinogen also increases r = 0.138 (p<0.05).
|
DISCUSSION
Socio-demographic parameters were captured in Table 1, in which the majority of the metabolic syndrome (Mets) patients were in the age bracket of 40-52 years of age. In this study, it could be because people with metabolic syndrome are more likely to have a steep decline in fitness levels. It could also be attributed to being in the age of 40 years, where they preferred mild to moderate activities like gardening or walking over intense aerobic exercises such as running. In contrast, their peers without metabolic syndrome had lower but steadier fitness levels over the years. This was agreed with earlier findings that metabolic syndrome is becoming a common disease of people in their late 30s and early 40s downwards9,10.
It also revealed that 52% of the metabolic syndrome patients were females while the male constituted only 48%. This study suggested that it could be a result of females having more body mass index and probably not exercising. This finding was in line with a report that concluded that Mets are found more among females than males11, the prevalence was higher in females than in males. In women, elevated BMI, low HDL cholesterol, increased waist circumference and hyperglycemia were significantly larger contributors to metabolic syndrome while in men these were hypertension and elevated triglycerides.
When grouped into marital status, it was found that married people (92%) were more affected than divorced and single people. In present study, this could be a result of married people not eating right and not having a quality marriage life alongside facing much stress at home which could lead to HBP. This finding was in line with a report that concluded that married people who are not in high-quality marriages are more prone to metabolic syndrome12 people in high-quality marriages are at lower risk of developing the metabolic syndrome. Social histories of patients should include an assessment of marital quality. When grouped into the duration of 7 months to 1 year, 2 to 5 years and 5 years above; the prevalence in percentage was the same at 33.5%, this could be due to the alarmingly increase in unhealthy life styles leading to the development of metabolic syndrome at a faster rate.
It was observed that the control subject had lower values of the parameter when compared to the metabolic syndrome patient and it could be a result of low-grade inflammation been caused by a metabolic syndrome that throws off some of the vital signs, SF, FIB, FBS, AST and ALT off the chart leading to its increase (Table 2). A significant increase in SF, FBS, ALT and AST was seen to be in the upper range of normal patients as they advanced in age. The increase could be a result of the reticulo-endothelia system responsible for phagocytosis that gets activated due to low-grade inflammations and the liver is one of the organs where ferritin is stored. This gets inflamed and leaks out more ferritin which leads to their increase. In a study done by Felipe et al.13, they reported that hyperferrtinemia observed in subjects with metabolic syndrome is associated with insulin resistance and fatty liver but not with iron overload and this was determined in liver biopsies by quantitative phlebotomy.
This could be a result of the body secreting low insulin for the fasting blood sugar. Sugar is either used immediately for energy or stored for later use, but as one ages, the pancreas produces less insulin which means blood sugar is elevated longer. The FIB in this study was not statistically significant with age (p>0.05) but is clinically significant. The FIB shows a progressive increase as one ages, but not significant in this study. This could be attributed to the body not being able to handle its removal any longer. Studies conducted show that these increased circulating levels of fibrinogen represent a slower disposal of fibrinogen rather than an increased production as one age. Although an age-related increase in blood fibrinogen has been observed in major epidemiological studies, little is known about the biochemical mechanism of this increase in fibrinogen level with age14. The ALT and AST could be a result of reduced liver capacity at one age. Troxel et al.12 postulated that a decline in transaminase level was noted in studied cases of metabolic syndrome but the biochemical mechanism by which this happens has not been ascertained yet (Table 3).
The males have higher levels of SF, AST and ALT than the females in this study and it is because males have more skeletal muscle mass where ferritin is stored and no loss of blood physiologically. Ledesma et al.15, postulated that the increase in skeletal muscle mass of the males led to them having more ferritin levels than the females both in normal and disease conditions.
According to Felipe et al.13, they also postulated that consumption of red meat has been related to metabolic syndrome and over-expression of c-reactive (ferritin) protein in women. According to Ledesma et al.15 they gave a conclusion based on their study that the result confirmed that high SF concentration is associated with metabolic syndrome and with oxidative stress markers indicating the importance of evaluating SF in the diagnosis of the metabolic syndrome. No clear mechanism exists to explain how sexes affect the development of abnormal liver function tests (AST and ALT). However, Solomon et al.16, observed that more levels seen in males area result of males having higher haemoglobin levels than females, after adjusting for obesity, hepatitis and gender and males havea greater risk of abnormal liver function which may be associated with higher haemoglobin levels.
Fibrinogen and FBS were observed to be higher in females than males. The females tend to have more adipose tissue than males and FIB elevation is strongly linked to being overweight. In a study done by Shankar et al.17 and Ding et al.18, they suggested that fibrinogen, an inflammatory factor significantly contributed to insulin resistance in females, while this impact might not be as prominent in males. In the overweight women subgroup, plasma fibrinogen was found to be connected to metabolic syndrome and it serves as a possible modifier in the progression from being overweight to developing metabolic syndrome. Increased FBS in females is thought to be a result of more visceral adipose tissue which leads to lower insulin secretion. The result aligned with Frank’s research which stated that in metabolic syndrome investigation, there is a connection between visceral adipose tissue, elevated fasting blood sugar level and type II diabetes in both males and females. However, a more significant correlation between visceral adipose tissue and glucose homeostasis disruption is observed in women (Table 4).
Duration shows to have no effect on the parameters, although, according to Solomon et al.16 reported that individuals with metabolic syndrome for 3 years had fibrinogen levels rose an average of 0.1 g/L every month. The researcher then suggested that fibrinogen is likely to be a useful biomarker to stratify individuals with metabolic syndrome into those with a high or low risk of future exacerbations and may identify those with a higher risk of mortality (Table 5). A moderate relationship was seen in SF and FIB, SF and ALT, SF and AST, FIB and ALT and AST. A study reported that ALT serum level usually predicts a future level of inflammation and oxidative stress marker such as fibrinogen so its increase will also increase fibrinogen but in an unreliable/weak manner19,20. Standardized methods across different laboratories and research groups should be employed for measuring SF, FIB, AST and ALT. This will help in comparing the results and drawing meaningful conclusions. Large-scale and multicenter studies to investigate the relationship between these biomarkers and metabolic syndrome in a diverse population. This will help in identifying any potential associations and correlations that may be specific to certain demographics or geographical regions. Educational materials and programs should be developed in order to raise awareness about the importance of these biomarkers in metabolic syndrome and their management.
CONCLUSION
The present study has revealed that Mets can lead to significant increases in SF, FIB, FBS, AST and ALT. There appears to be a weak positive relationship between FIB and ALT and this is likely to be able to predict future levels of inflammation and oxidative stress markers such as fibrinogen. The parameters improved towards the normal range among those on drugs and marital status affects the incidence of Mets with the married presenting with the highest cases. Males showed more elevation in SF, AST and ALT than females which also showed elevation in FIB and FBS than males. Mets show to advance in age as they get older. There should be a consideration in the determination of SF and FIB as an adjunct test alongside the basic investigation (AST and ALT) to expand the scope of the diagnosis of Mets. There should be a synergy established between clinicians and health workers managing these patients to create awareness of how the levels of these parameters and their early detection in variation of their levels will lead to good and appropriate management of their condition and possible treatment. There should be an aggressive campaign by healthcare providers to enlighten the public on the existence and danger of Mets and the need for regular check-ups to achieve early diagnosis and strong emphasis is also placed on choosing a good lifestyle as early as possible to avoid complications.
SIGNIFICANCE STATEMENT
Serum ferritin (SF), fibrinogen (FIB) and some Liver Function Tests (LFT) were evaluated in Mets patients. Significance increases were seen in SF, FIB, FBS, AST and ALT which may be a result of low-grade inflammation being caused by this condition. The SF and FIB alongside AST and ALT should be considered valuable for the proper diagnosis and detection of Mets. There should be adequate cooperation between clinicians and other health workers for the proper management of Mets patients and enlightenment of the public on the danger of Mets and the need for regular check-ups which is crucial for early detection of potential health issues, allowing timely intervention and also emphasizing on a good lifestyle to prevent complications.
ACKNOWLEDGMENTS
The authors wish to acknowledge the Metabolic syndrome patients attending the Internal Medicine Department, Diabetic Clinic, for cooperation in giving voluntarily their samples. We also like to thank the consultant for giving us access to the patient folder.
REFERENCES
- Gebreyes, Y.F., D.Y. Goshu, T.K. Geletew, T.G. Argefa and T.G. Zemedu et al., 2018. Prevalence of high bloodpressure, hyperglycemia, dyslipidemia, metabolic syndrome and their determinants in Ethiopia: Evidences from the National NCDs STEPS Survey, 2015. PLoS ONE, 13.
- Cullis, J.O., E.J. Fitzsimons, W.J.H. Griffiths, E. Tsochatzis and D.W. Thomas, 2018. Investigation and management of a raised serum ferritin. Br. J. Haematol., 181: 331-340.
- Mackie, I.J., S. Kitchen, S.J. Machin and G.D.O. Lowe, 2003. Guidelines on fibrinogen assays. Br. J. Haematol., 121: 396-404.
- Chen, Z.W., L.Y. Chen, H.L. Dai, J.H. Chen and L.Z. Fang, 2008. Relationship between alanine aminotransferase levels and metabolic syndrome in nonalcoholic fatty liver disease. J. Zhejiang Univ. Sci. B, 9: 616-622.
- Chen, P.H., J.D. Chen and Y.C. Lin, 2009. A better parameter in predicting insulin resistance: Obesityplus elevated alanine aminotransferase. World J. Gastroenterol., 15: 5598-5603.
- Ingram, G.I.C., 1952. The determination of plasma fibrinogen by the clot-weight method. Biochem. J., 51: 583-585.
- McFadden, S., C. Briggs, B. Davis, J. Jou and S. Machin, 2008. The reformed International Council for Standardization in Hematology (ICSH). Int. J. Lab. Hematol., 30: 89-90.
- Reitman, S. and S. Frankel, 1957. A colorimetric method for the determination of serum glutamic oxalacetic and glutamic pyruvic transaminases. Am. J. Clin. Pathol., 28: 56-63.
- Aung, K.C.Y., L. Feng, K.B. Yap, Y.Y. Sitoh, I.Y.O. Leong and T.P. Ng, 2011. Serum albumin and hemoglobin are associated with physical function in community-living older persons in Singapore. J. Nutr. Health Aging, 15: 877-882.
- Mattsson, N., T. Rönnemaa, M. Juonala, J.S.A. Viikari and O.T. Raitakari, 2007. The prevalence of the metabolic syndrome in young adults. The cardiovascular risk in young finns study. J. Intern. Med., 261: 159-169 .
- Ye, Y., Q. Zhou, W. Dai, H. Peng and S. Zhou et al., 2023. Gender differences in metabolic syndrome and its components in Southern China using a healthy lifestyle index: A cross-sectional study. BMC Public Health, 23.
- Troxel, W.M., K.A. Matthews, L.C. Gallo and L.H. Kuller, 2005. Marital quality and occurrence of the metabolic syndrome in women. Arch. Intern. Med., 165: 1022-1027.
- Felipe, A., E. Guadalupe, P. Druso, M. Carlos and S. Pablo et al., 2015. Serum ferritin is associated with metabolic syndrome and red meat consumption. Oxid. Med. Cell. Longevity, 2015.
- Fu, A. and K.S. Nair, 1998. Age effect on fibrinogen and albumin synthesis in humans. Am. J. Physiol. Endocrinol. Metab., 275: E1023-E1030.
- Ledesma, M., Y. Hurtado-Roca, M. Leon, P. Giraldo and M. Pocovi et al., 2015. Association of ferritin elevation and metabolic syndrome in males. results from the Aragon workers' health study (AWHS). J. Clin. Endocrinol. Metab., 100: 2081-2089 .
- Solomon, C., A. Gröner, Y. Jian and P. Inna, 2015. Safety of fibrinogen concentrate: Analysis of more than 27 years of pharmacovigilance data. Thromb. Haemost., 113: 759-771.
- Shankar, A., J.J. Wang, E. Rochtchina and P. Mitchell, 2006. Positive association between plasma fibrinogen level and incident hypertension among men: Population-based cohort study. Hypertension, 48: 1043-1049.
- Ding, L., C. Zhang, G. Zhang, T. Zhang and M. Zhao et al., 2015. A new insight into the role of plasma fibrinogen in the development of metabolic syndrome from a prospective cohort study in urban Han Chinese population. Diabetology Metab. Syndr., 7.
- Mauvais-Jarvis, F., 2018. Gender differences in glucose homeostasis and diabetes. Physiol. Behav., 187: 20-23.
- Hessien, M., M. Ayad, W.M. Ibrahim and B. Izz ul Arab, 2015. Monitoring coagulation proteins during progression of liver disease. Indian J. Clin. Biochem., 30: 210-216 .
How to Cite this paper?
APA-7 Style
Okpokam,
D.C., Muoka,
D.L., Kooffreh-Ada,
M., Isong,
I., Okpokam,
O.E., Efobi,
H.A. (2024). Evaluation of Different Diagnostic Strategies in the Assessment and Management of Metabolic Syndrome Patients in South, Nigeria. Asian Science Bulletin, 2(4), 304-315. https://doi.org/10.3923/asb.2024.304.315
ACS Style
Okpokam,
D.C.; Muoka,
D.L.; Kooffreh-Ada,
M.; Isong,
I.; Okpokam,
O.E.; Efobi,
H.A. Evaluation of Different Diagnostic Strategies in the Assessment and Management of Metabolic Syndrome Patients in South, Nigeria. Asian Sci. Bul 2024, 2, 304-315. https://doi.org/10.3923/asb.2024.304.315
AMA Style
Okpokam
DC, Muoka
DL, Kooffreh-Ada
M, Isong
I, Okpokam
OE, Efobi
HA. Evaluation of Different Diagnostic Strategies in the Assessment and Management of Metabolic Syndrome Patients in South, Nigeria. Asian Science Bulletin. 2024; 2(4): 304-315. https://doi.org/10.3923/asb.2024.304.315
Chicago/Turabian Style
Okpokam, Dorathy, Chioma, Daniel Lotachukwu Muoka, Mbang Kooffreh-Ada, Idongesit Isong, Ogha Eyamnzie Okpokam, and Henry Afamefuna Efobi.
2024. "Evaluation of Different Diagnostic Strategies in the Assessment and Management of Metabolic Syndrome Patients in South, Nigeria" Asian Science Bulletin 2, no. 4: 304-315. https://doi.org/10.3923/asb.2024.304.315

This work is licensed under a Creative Commons Attribution 4.0 International License.