
Addressing Structural Complexity in Asmari Fractured Reservoirs with Borehole Imaging Technique and VSP
-
Zohreh Movahed


Springer, Alzare, Toronto, Canada
| Received 09 Mar, 2024 |
Accepted 27 May, 2024 |
Published 31 Dec, 2024 |
Background and Objective: Exploration of carbonate reservoirs in structurally complex areas, particularly those overlain by extensive evaporate formations, poses significant challenges in structural delineation. Lack of adequate structural geology information, especially in naturally fractured reservoirs, hampers drilling operations. In Iran, insufficient data on fractured reservoirs have hindered drilling activities. This study aims to assess the impact of limited structural information on drilling operations in complex naturally fractured reservoirs and underscores the efficacy of borehole imaging tools in addressing these challenges. The primary objective is to establish a precise structural model for the Asmari reservoir in the Gachsaran field. Materials and Methods: Utilizing well site geologist reports and formation cuttings analysis, this research examines drilling challenges encountered in penetrating the lower Asmari reservoir. Oil-Based Mud Micro Imager-Ultrasonic Borehole Imager (OBMI-UBI) tools were deployed in the interval from 2117 to 2772 m to investigate discrepancies in predicted reservoir depths. Results: The analysis revealed a deviation in the well trajectory, with an initial northeast (NE) direction shifting gradually to southwest (SW) until reaching total depth (TD). Caprock and bedding dips plotted alongside the trajectory unveiled parallelism with the middle Asmari layers, indicating the need for a directional change to exit the reservoir successfully. Borehole imaging played a pivotal role in delineating structural complexities, providing crucial insights for the effective positioning of wells. Conclusion: Insufficient structural data in complex carbonate reservoirs pose significant challenges to drilling operations. However, the deployment of borehole imaging tools, as demonstrated in this study, enables precise structural modeling and enhances drilling efficiency in such environments.
INTRODUCTION
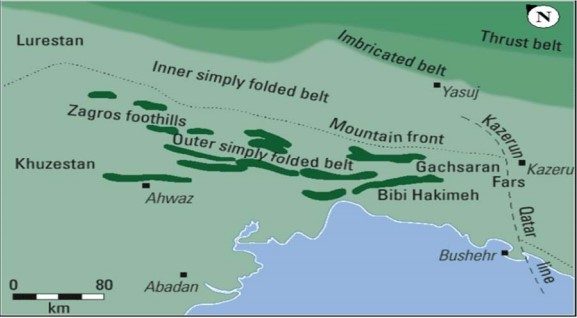
The Zagros Mountains, characterized by concentric folding patterns, present a unique geological phenomenon1. Understanding the subsurface structural features within this region is crucial for effective exploration and well planning2. Challenges in regions like the Gachsaran oil field arise from geological complexities, including fractured reservoirs and varying layers of anhydrite and salt3. Traditional drilling methods face limitations, particularly in obtaining geological information in oil fields of southwest Iran4.
Borehole imaging tools, such as the Oil-Base Micro imager (OBMI) and Ultrasonic Borehole Imager (UBI), have emerged as crucial in reservoir characterization, especially in thinly laminated reservoirs5. These tools, along with geological logs and the Versatile Seismic Imager (VSI), offer high-resolution directional datasets that aid in lithofacies classification6. Moreover, they play a significant role in characterizing oil reservoirs and providing quantitative resistivity of the invaded zone, particularly in carbonate and sandstone reservoirs (Movahed, 2007)7.
This study focuses on a specific well targeting the Asmari Formation in the Zagros Mountains, where drilling ceased prematurely. The aim is to develop a comprehensive dip/structural model using UBI and OBMI tools and integrate it with data from VSI to generate a Vertical Seismic Profile (VSP). The interpretation of VSP findings will shed light on the well's inability to reach its intended target, highlighting the significance of structural information and the efficacy of borehole imaging tools in overcoming drilling challenges within complex geological settings. This study aims to assess the structural complexities encountered during drilling operations in the Asmari Formation of the Zagros Mountains using borehole imaging tools and integrate the findings with seismic data to understand the reasons behind drilling setbacks.
MATERIALS AND METHODS
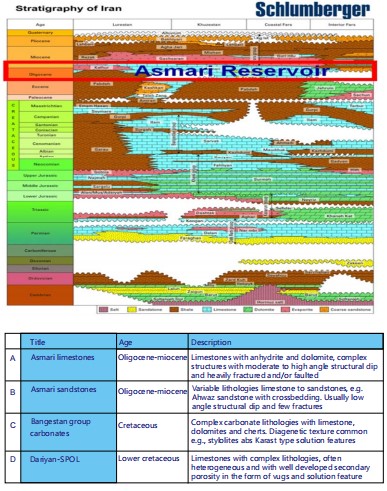
The Zagros Mountains exhibit unique geological features, with concentric folding patterns predominant in the Cretaceous and younger units. These formations, characterized by expansive anticlines and constricted synclines, are marked by out-of-syncline thrusts, particularly in robust geological formations. Effective exploration and well planning within this region necessitate a deep understanding of subsurface structural features (Fig. 1).
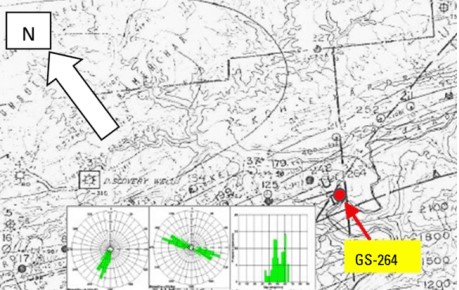
The critical importance of this knowledge, particularly in regions like Gachsaran, Agha Jari and Bibi Hakimeh within the Zagros belt. Challenges, exemplified by well GS-264 in the Gachsaran oil field, include fractured reservoirs, varying layers of anhydrite and salt and unanticipated variations in formation thickness. Strategic interventions such as sidetracking become necessary to overcome these complexities and reach targeted reservoirs or oil columns (Fig. 2 and 3).
|
|
The GS-264 well was drilled in 2004 to evaluate the Asmari Formation, employing Through Logging Conditions (TLC) for logging operations due to its challenging trajectory. Utilizing OBMI (Oil-Based Mud Imager) and UBI (Ultrasonic Borehole Imager) aimed to enhance fracture characterization and the structural model, crucial for understanding the structural complexities and addressing the missed lower Asmari10. To extend the structural model with precision beyond the total depth (TD), a Vertical Seismic Profile (VSP) was conducted, utilizing dip data obtained from borehole images for accurate processing. A thorough analysis of the complete OBMI-UBI log data in Geoframe software was performed during the study, which spanned from April 2004 to June 2004. Further comprehensive and integrated analysis using VSP and OBMI-UBI occurred in 2023, contributing to the ongoing study's depth and insights.
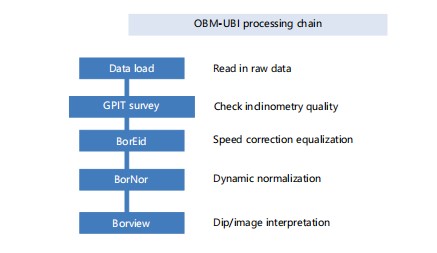
To improve the OBMI-UBI data quality, BorEid processing was employed. All petrophysical logs and images were depth-matched to a reference log. BorNor was utilized to equalize and normalize the images, thus enhancing the visualization of formation features.
|
|
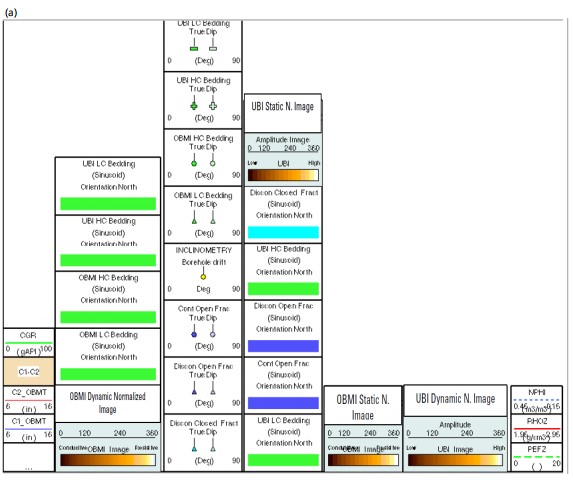
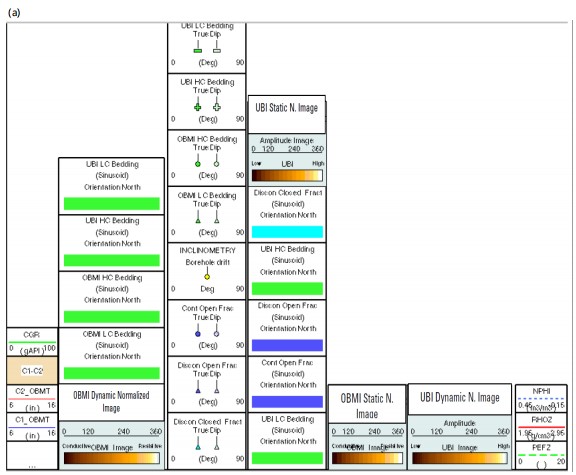
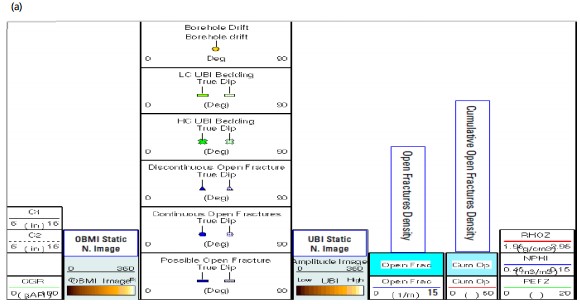
Image logs were interpreted by highlighting resistive units in bright colors and conductive units with lower resistivity in dark colors. The interpretation commenced with the manual selection of dips through sinusoidal techniques on oriented images at a 1:20 scale to reduce human error. Once selected, the dips were classified into bed boundaries and fractures using Borview.
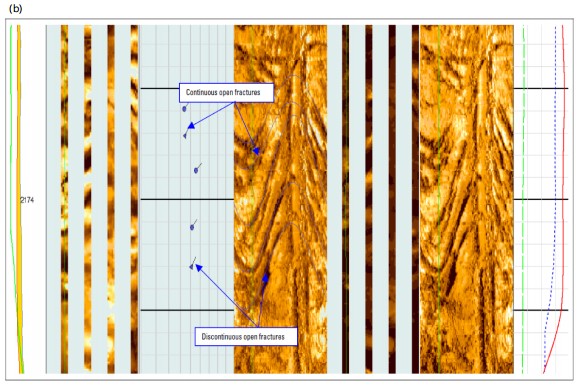
Distinctions between open and closed fractures varied for oil-based mud imaging tools (OBMI and UBI) compared to water-based mud imaging tools (FMI). On OBMI images, open fractures were identified as those with low acoustic amplitude traces (dark) intersecting the sedimentary structure at a high angle, exhibiting a continuous trace with strong acoustic contrast and/or a wide apparent aperture. Closed fractures were discerned using UBI, being clear fractures visible on OBMI images but absent on UBI images (Fig. 4). Utilizing the dip data, a computer-based cross-section along the NNE-SSW plane was constructed in Strucview. To extend the structural model beyond the well and achieve greater depth than the total depth (TD) with reasonable accuracy, a Vertical Seismic Profile (VSP) was conducted. The dip data obtained from borehole images played a crucial role in VSP processing, with accuracy dependent on the dip model applied to the area surrounding the studied well.
RESULTS AND DISCUSSION
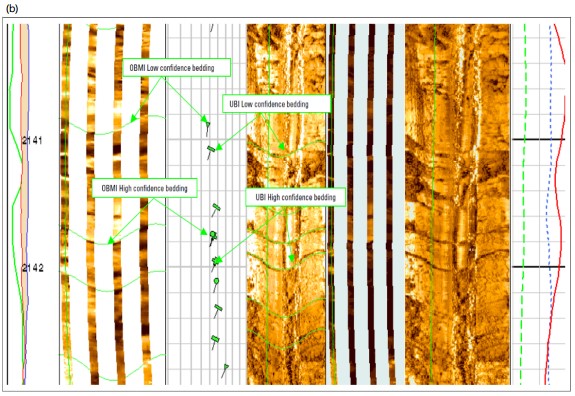
Structural interpretation: Borehole imaging techniques, which encompass both electrical (OBMI) and acoustic (UBI amplitude) methods, provide a detailed examination of the upper section of the Asmari Formation. These techniques reveal distinct layering and bedding features, shedding light on the geological characteristics of the subsurface. The identified layer and bed contacts exhibit a range of characteristics, including sharp, planar connections and vague, uneven contacts. The confidence levels associated with these contacts vary based on the sharpness and planarity of the features, high confidence is linked to sharp features, whereas low confidence is associated with less planar features.
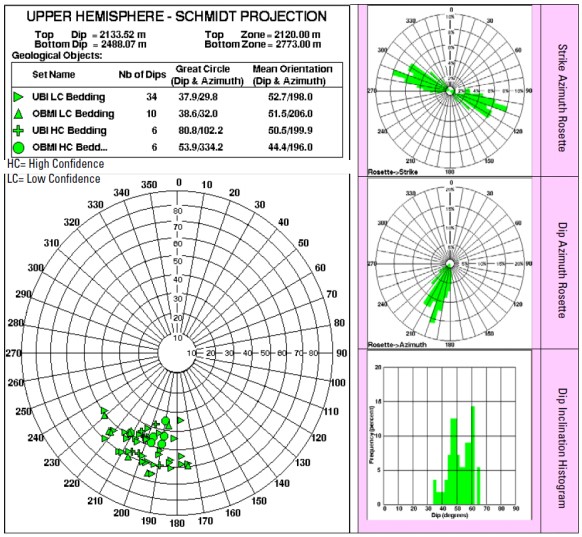
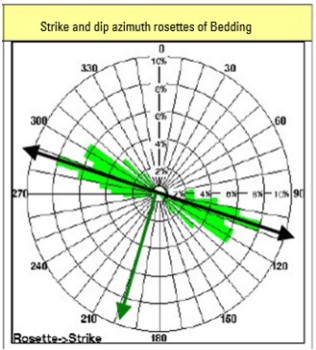
The structural dip is calculated using the characteristics of these identified layer and bed contacts. Statistical analysis of bedding dips obtained from UBI and OBMI data reveals a prevailing dip azimuth of S18W and a strike ranging from S72E to N72W, with a spread of 25° (Fig. 5a-b). The dip magnitude exhibits considerable variability, ranging from 34 to 63° (Fig. 6).
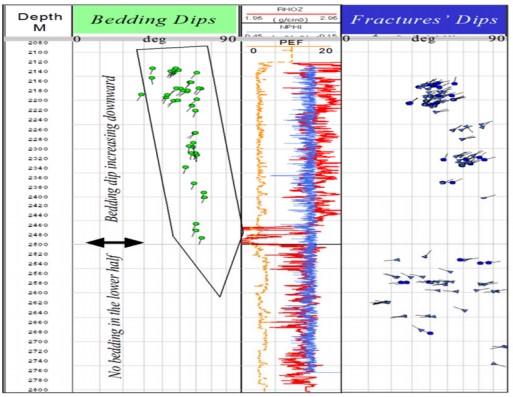
A continuous depth plot of bedding dips illustrates a concentration of all identified dips in the upper half of the logged interval, with no computed dips in the lower half. Additionally, the dip spread is more pronounced in the uppermost zone compared to the rest of the interval.
Despite the meticulous analysis conducted, no indications of fault presence were observed throughout the entire logged interval. This comprehensive examination using borehole imaging techniques provides valuable insights into the geological structure and layering of the Asmari Formation in the specified depth range.
The results derived from borehole imaging techniques on the Asmari Formation, which utilized electrical (OBMI) and acoustic (UBI amplitude) methods, offer an intricate look into the sub surface’s geological structure and characteristics. These findings are critical in understanding layering, bedding features and dip directions and magnitudes within the formation, providing no evidence of fault presence through the logged interval.
In conclusion, the current findings concerning the structural interpretation of the Asmari Formation through borehole imaging techniques align well with the existing literature, emphasizing the utility and accuracy of these methods in geological studies. While the absence of fault indications contrasts with some expectations based on regional geology, this discrepancy highlights the need for continuous technological and methodological advancements in subsurface imaging. The studies referenced offer a complementary perspective on the complexities of geological structures, underscoring the significance of integrating various data sources and imaging techniques in petroleum and geological sciences.
Fracture analysis: To discriminate between open and closed fractures, the study employed OBMI (Oil-Based Micro-Imager) and UBI (Ultra-sonic Borehole Imager) amplitude images. The UBI is primarily adept at identifying open fractures, whereas OBMI images depict open fractures with a resistive appearance. Within a specific depth range (2165-2220 m), located 20-25 m below the Cap Rock, a substantial occurrence of fracturing is conspicuous. In the remaining interval, the development of fractures is comparatively less pronounced. Most fractures manifest as low amplitude traces on UBI amplitude images and appear resistive on OBMI images, classifying them as open fractures. Further categorization of these open fractures is undertaken based on their continuity as continuous-open, discontinuous-open and possible-open, determined by the persistence of their low-amplitude traces on UBI acoustic amplitude images. Closed fractures are not discernible, their potential presence would be identified by OBMI images, portraying them as resistive fractures with minimal visibility on UBI amplitude images (Fig. 7a and b).
|
|
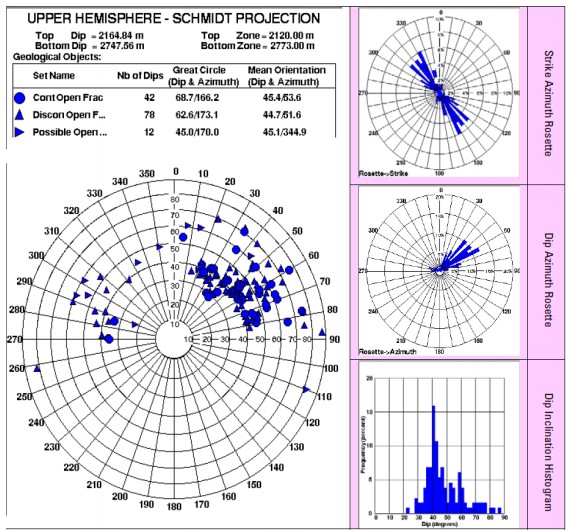
Continuous and discontinuous open fractures congregate densely in the northeastern (NE) region, falling within the 40 to 50° inclination circle on the Schmidt Stereonet (upper hemisphere) and the dip-pole density contour diagram, displaying a broad range of dip azimuths. Continuous open fractures predominantly dip to N62E, with a 20° spread on either side and strike dominantly at N28W-S28E with a similar azimuthal spread. Discontinuous open fractures exhibit a dominant azimuth around N58E with a 25° spread on one side and on the strike azimuth rosette, they show a similar spread with the dominant strike azimuth of N32W-S32E. The dip inclination varies from 30 to 84°, with the majority dipping at 34 to 60° and a dominant dip inclination of 41° (Fig. 8).
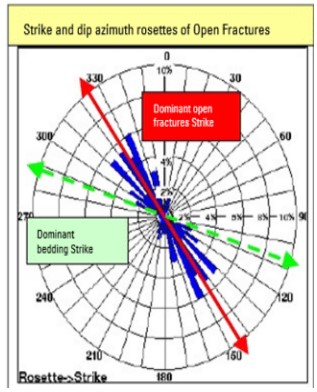
The dip and strike rosettes of bedding and open fractures suggest that most fractures are oblique to the bedding, with only a small percentage aligning parallel to the bedding and dipping in the opposite direction, categorized as longitudinal fractures (Fig. 9).
Open fractures are predominantly concentrated in the upper one-third section, with the highest density observed in the 2165-2220 m range, approximately 20-25 m below the Cap Rock. Areas of higher fracture density (number of fractures per meter) are identified at 2165-2175, 2190-2220, 2370 and 2580 m. Assuming that only open fractures contribute to production, a predictive productive profile for the Asmari carbonates intersected by the study well was established by integrating fracture density over the fractured interval. According to this analysis, the most productive interval is anticipated to be at 2165-2220 m. Notably, the inclination of bedding dips increases with depth, transitioning from an average value of 45° in the uppermost zone at 2120-2180 m to 63° in the middle part around 2490 m (Fig. 10).
|
|
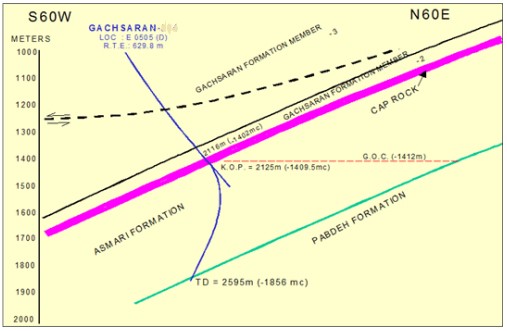
Addressing structural complexity through comprehensive well logging analysis: According to the comprehensive report provided by the well site geologist, it was observed that the well encountered challenges in reaching the lower Asmari Formation, specifically noting a deviation from the anticipated lower contact depth of 2588m, as initially forecasted (Fig. 11). Surprisingly, the true vertical depth (TVD) surpassed 2800m before reaching the target formation. This unexpected variance in depth prompted the National Iranian South Oil Company (NISOC) to initiate a more thorough investigation. Recognizing the importance of gaining a detailed understanding of the geological complexities involved, NISOC decided to employ advanced borehole imaging tools. This strategic move aims to enhance the precision and accuracy of the geological assessment, providing invaluable insights into the structural intricacies that may have contributed to the deviation from the projected well trajectory.
Therefore, it became imperative to seek an alternative explanation for the well's inability to successfully penetrate the lower Asmari Formation. In order to delve deeper into this matter, a thorough examination of the bedding dip data was conducted in conjunction with a detailed analysis of the well trajectory.
|
The trajectory of the well exhibited a noteworthy deviation pattern. It commenced with a deviation towards the northeast in the upper interval and gradually transitioned towards the southwest, maintaining this trajectory with a maximum deviation of 36° until the total vertical depth (TVD) was reached.
The challenge of not reaching the Lower Asmari and Pabdeh Formation at the expected depth necessitated a consideration of potential factors such as a high structural dip or the presence of a reverse fault.
|
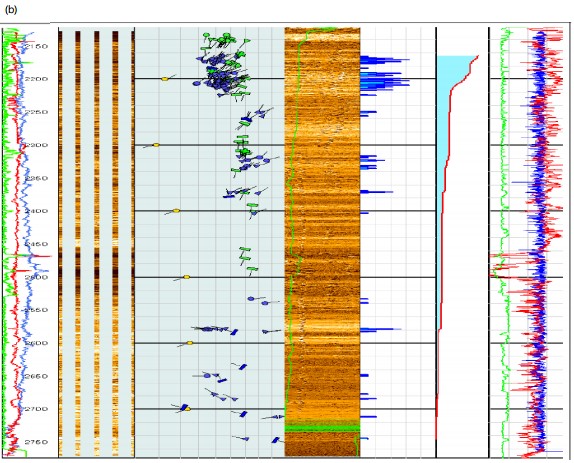
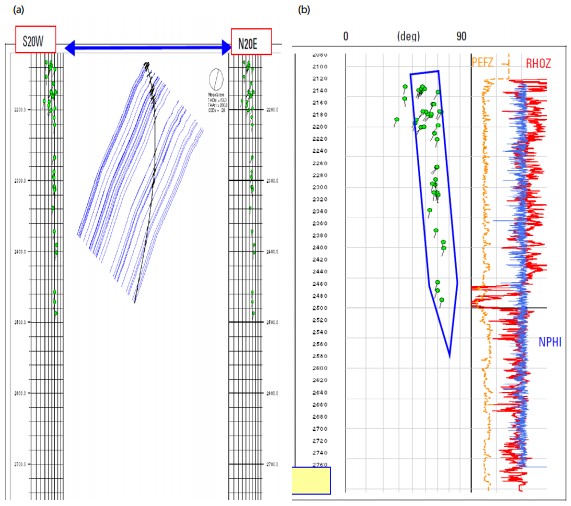
Upon closer inspection, borehole images captured in oil-based mud did not indicate the presence of a fault. However, they did reveal a steeper dip, which intensified as the well delved deeper into the subsurface. These images provide a comprehensive visualization of the well trajectory, structural dip and other pertinent geological features Fig. 12 and 13(a-b).
|
|
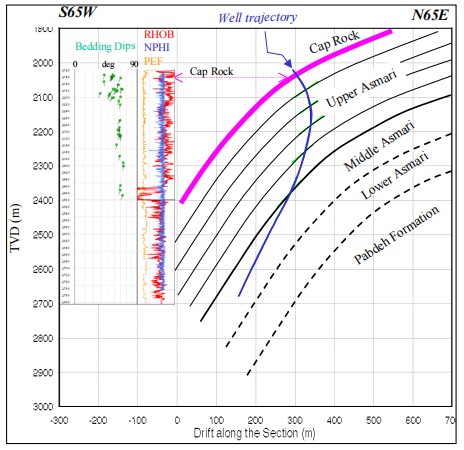
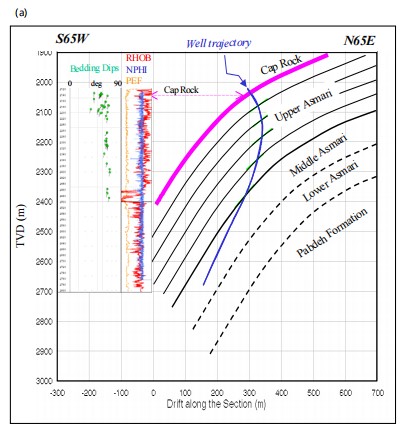
The detailed examination of the on-scale cross-section, conducted along the N65E-S65W plane across the well, provided insights into its trajectory concerning the geological formations. The analysis revealed a consistent adherence to the dips of the formations upon entry into the Middle Asmari. Consequently, the well found itself confined within the Middle Asmari, unable to traverse the boundary between the Asmari and Pabdeh Formations. This circumstance elucidates why the well did not intersect beds or layers, preventing the computation of dips in the lower half of the drilled section.
|
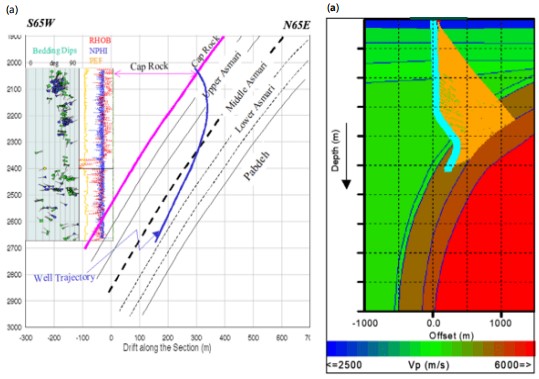
Upon plotting cap rock and bedding dips alongside the well trajectory on the N65E-S65W plane, a clear alignment emerged. The well ran parallel to the dip of the Middle Asmari beds/layers in the lower half of the logged interval. This alignment was further substantiated by constructing a model that integrated bedding dips from oil-based mud images with the well trajectory projected onto the same S65W-S65E plane. In this model, the vertical axis represented true vertical depth (TVD) and the horizontal axis represented drift, both consistently plotted at a uniform scale. Remarkably, in the proximity of the Middle Asmari section, the well consistently paralleled the bedding, leading to its continuous penetration within the Middle Asmari Formation until reaching total depth (TD). Consequently, the model serves as a valuable tool for elucidating why the well failed to penetrate the lower Asmari and why no bedding features were observed in the borehole images in the lower half of the logged interval. This comprehensive understanding is visually providing a detailed depiction of the well's trajectory and its alignment with geological features (Fig. 14-16).
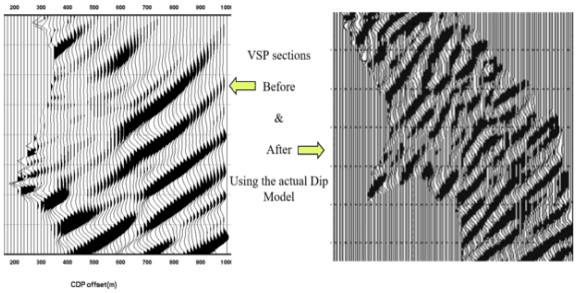
In the intricate realm of complex structural geometries within well environments, the efficacy of borehole seismic (VSP) data in delineating the surroundings of a well may be compromised when acquired in the absence of prior knowledge regarding the dip model. The significance of the dip model becomes apparent as processing outcomes can lead to misleading interpretations without an accurate representation of the actual dip model encompassing the well. To address this challenge, a meticulous approach was undertaken by conducting a rig source VSP using the Versatile Seismic Imager (VSI) on the deviated well GS-264 situated in the Gachsaran Field.
|
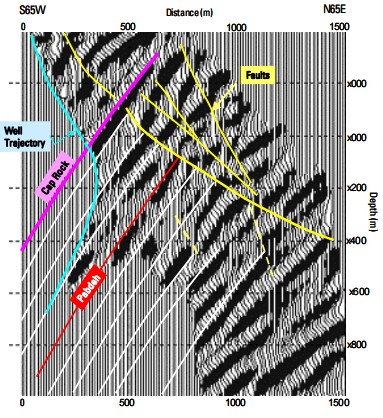
In the pursuit of enhancing the reliability of the VSP data, a dip model derived from borehole images, as demonstrated in a preceding example, was integrated into the VSP data processing. This strategic utilization of the dip model yielded a high-quality seismic section, providing a discerning depiction of dipping reflectors and faults within the geological formation. Seeking additional insights, a Vertical Seismic Profile (VSP) was executed in the study well through the utilization of a 3-axis tool, namely the Versatile Seismic Imager (VSI) Fig. 15(a-b).
In regions characterized by intricate structural geometries, the application of borehole seismic (VSP) data for imaging well structures faced potential limitations in the absence of prior dip model knowledge. To circumvent this challenge, preliminary modeling was conducted using Oriented Borehole Micro Imager (OBMI) and Ultrasonic Borehole Imager (UBI) data, resulting in the development of a comprehensive Dip/Structural model. Subsequently, a velocity model was meticulously crafted based on this established model Fig. 16(a-b).
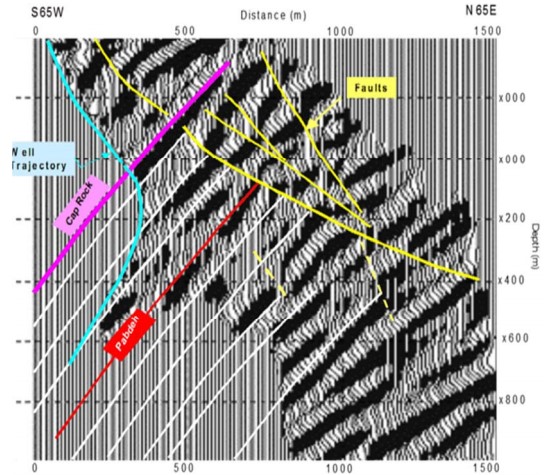
Leveraging the refined dip/structural model and the data acquired from the Versatile Seismic Imager (VSI), a high-quality Vertical Seismic Profile (VSP) was generated to meticulously unravel the structural complexities surrounding the deviated well. The outcome of this processing was a superior seismic section, illuminating prominent dipping reflectors and faults within the geological strata.
|
|
|
Ultimately, the high-quality VSP section conclusively dispelled the notion of a fault as the causative factor, revealing that the issue stemmed from drilling the well parallel to the dip of the Middle Asmari beds/layers (Fig. 17 and 18). This comprehensive analysis, incorporating advanced modeling and seismic imaging techniques, elucidated the geological intricacies surrounding the well and provided valuable insights for future well planning and drilling endeavors.
|
CONCLUSION
In summary, the structural dip exhibits a non-constant pattern, progressively increasing with depth while maintaining a consistent azimuth of S18W. Ranging from an average of 45° in the uppermost section of Asmari to 63° in the middle Asmari, this upward trend suggests a high structural dip. Despite the absence of faults according to borehole images in oil-based mud, the steeper dip observed indicates potential challenges in drilling deeper. The decision to discontinue drilling at this point prevents unnecessary expenditure of time and resources, as continued drilling under the same deviation would likely have hindered progress beyond the Middle Asmari layer. This study has successfully resolved structural complexities, leading to a precise determination of the well's location within the Asmari reservoir. The dip classification based on geological logs has provided a clear and straightforward representation of the structural features. The research successfully tackles and resolves structural complexities, precisely identifying the well's location within the Asmari reservoir. This accomplishment had noteworthy advantages, potentially leading to cost savings in drilling projects and facilitating the exploration of additional wells within the field. Furthermore, this study stands as a valuable reference for researchers, providing insights into previously uncharted areas of structural complexity within the reservoir.
SIGNIFICANCE STATEMENT
The comprehensive understanding gained about the Asmari structure has significantly contributed to enhancing the reservoir model employed by the operator. This advancement empowered NIOC South to more accurately assess reservoir potential and improve their proficiency in utilizing OBMI-UBI data, particularly in instances where 3D seismic data is either unavailable or of suboptimal quality. In essence, this study not only resolves critical structural issues but also elevates the operator's capacity to model and evaluate the Asmari reservoir, even in scenarios where conventional data sources are constrained.
ACKNOWLEDGMENT
Our sincere thanks go out to everyone who played a crucial role in making this project a success. Without their steadfast support, reaching this milestone would have been impossible. Special gratitude is extended to NIOC South for their generous provision of vital data and resources, which proved to be indispensable in the successful completion of our project.
REFERENCES
- Mitra, S., 2002. Fold-accommodation faults. AAPG Bull., 86: 671-693.
- Movahed, Z., R. Junin, Z. Safarkhanlou and M. Akbar, 2014. Formation evaluation in Dezful embayment of Iran using oil-based-mud imaging techniques. J. Pet. Sci. Eng., 121: 23-37.
- Movahed, Z., F. Aghajari and A.A. Movahed, 2023. Characterization of reservoir by using geological, reservoir and core data. J. Appl. Sci., 23: 34-46.
- Alavi, M., 2004. Regional stratigraphy of the Zagros fold-thrust belt of Iran and its proforeland evolution. Am. J. Sci., 304: 1-20.
- Khoshbakht, F., H. Memarian and M. Mohammadnia, 2009. Comparison of Asmari, Pabdeh and Gurpi formation's fractures, derived from image log. J. Pet. Sci. Eng., 67: 65-74.
- Shariatinia, Z., M. Haghighi, S. Feiznia, D. Hall, G. Levresse, A.M. Dehghani and M. Rashidi, 2013. Paleofluid analysis from fracture-fill cements in the Asmari limestones of the Kuh-I-Mond field, SW Zagros, Iran. Arabian J. Geosci., 6: 2539-2556.
- Movahed, Z., M. Ashraf and A.A. Movahed, 2023. Assessment of fracture density distribution from image logs for sensitivity analysis in the Asmari fractured reservoir. Earth Sci. Hum. Constr., 3: 99-118.
- Park, R., 1997. Foundation of Structural Geology. 1st Edn., Routledge Abingdon, Oxfordshire, ISBN: 9780203825112, Pages: 214.
- Ko, J., 2017. Petroleum geology of Iran. J. Korean Soc. Mineral Energy Resour. Eng., 54: 549-606.
- Movahed, Z. and A.A. Movahed, 2023. Analytical methods to develop accurate structural model for the Asmari reservoir. Int. J. Chem. Eng. Mater., 2: 81-104.
How to Cite this paper?
APA-7 Style
Movahed,
Z. (2024). Addressing Structural Complexity in Asmari Fractured Reservoirs with Borehole Imaging Technique and VSP. Asian Science Bulletin, 2(4), 445-462. https://doi.org/10.3923/asb.2024.445.462
ACS Style
Movahed,
Z. Addressing Structural Complexity in Asmari Fractured Reservoirs with Borehole Imaging Technique and VSP. Asian Sci. Bul 2024, 2, 445-462. https://doi.org/10.3923/asb.2024.445.462
AMA Style
Movahed
Z. Addressing Structural Complexity in Asmari Fractured Reservoirs with Borehole Imaging Technique and VSP. Asian Science Bulletin. 2024; 2(4): 445-462. https://doi.org/10.3923/asb.2024.445.462
Chicago/Turabian Style
Movahed, Zohreh.
2024. "Addressing Structural Complexity in Asmari Fractured Reservoirs with Borehole Imaging Technique and VSP" Asian Science Bulletin 2, no. 4: 445-462. https://doi.org/10.3923/asb.2024.445.462

This work is licensed under a Creative Commons Attribution 4.0 International License.