
Deciphering the Asmari Formation: Advanced Obmi and Petrophysical Log Analysis for Fractured Reservoir Assessment
-
Zohreh Movahed


Springer Company, Alzare, Toronto, Canada
| Received 09 Mar, 2024 |
Accepted 31 May, 2024 |
Published 31 Dec, 2024 |
Background and Objective: Accessing the Asmari reservoir poses challenges due to its complex structure, affecting well-test analysis accuracy in delineating fracture properties. Traditional core sampling struggles in highly fractured regions, leading to low recovery rates in unfavorable reservoir sections. The main objective of this study is to explore the challenges of accurately characterizing the fracture properties of the Asmari reservoir due to its structural complexities. Specifically, it aims to assess the effectiveness of using advanced borehole imaging tools, namely Oil-Based Mud Imager (OBMI) and Ultrasonic Borehole Imager (UBI), as alternatives to traditional core sampling and well-testing methods. Materials and Methods: Well GS-325 utilized OBMI and UBI tools to explore the Asmari Formation. The study involved a meticulous examination of geological features and structural attributes to understand the factors contributing to the observed thickness. Interpretation included manual dip picking using sinusoid techniques, followed by the classification of dips into bed boundaries and fractures. Results: The investigation revealed geological variations affecting the expected thickness of the Asmari Formation, enhancing comprehension of its complexities. The study identified 517 fractures within the Asmari interval, elucidating structural intricacies within the reservoir. Conclusion: The study demonstrates the successful use of OBMI/UBI imaging tools for identifying fractures and structural details in the Asmari Formation, despite challenges in shifting from oil-based to water-based drilling fluids.
INTRODUCTION
The Zagros Mountains, a geological wonder shaped by ancient tectonic forces, stand as a focal point for numerous development endeavors, particularly in the oil and gas sector. Navigating the depths of these formations resembles unraveling an intricate puzzle, where deciphering the angles of geological layers and unraveling subsurface fault networks are crucial for successful well projects1. The difficulty arises from the unpredictable characteristics of these formations. Elements like steep bedding angles or hidden faults frequently cause considerable discrepancies between predicted and real strata thicknesses2. Even seemingly gentle surface areas can reveal abrupt inclines during drilling, diverting wells and obstructing access to desired reservoirs3. Consequently, redirection or sidetracking of wells becomes necessary to tap into previously overlooked oil pools or reservoirs.
Amidst this geological complexity, the Asmari Formation emerges as a key player. Dating back to the Oligocene-Miocene era, it holds substantial economic value, housing abundant oil reserves. However, evaluating formations like Asmari, predominantly composed of carbonates, has historically posed challenges due to inconsistent correlations between traditional evaluation methods and hydrocarbon production. The need for advancements in carbonate evaluation aligns with industry demands for efficient production techniques4.
In this complex geological setting, borehole imaging logs have become indispensable for discerning structural layouts and reservoir configurations5. Precision in defining reservoir attributes, particularly in thinly layered reservoirs, has become crucial for optimal field development6. Logs from OBMI-UBI allow structural and reservoir geologists to quickly identify fracture characteristics and classify various types of fractures along the wellbore7. Fractured reservoirs, characteristic of hydrocarbon reserves, introduce another layer of complexity due to irregular porosity and permeability distributions. Understanding fractures within the Asmari reservoir remains crucial, as they serve as conduits for petroleum migration, potentially delineating high production zones8.
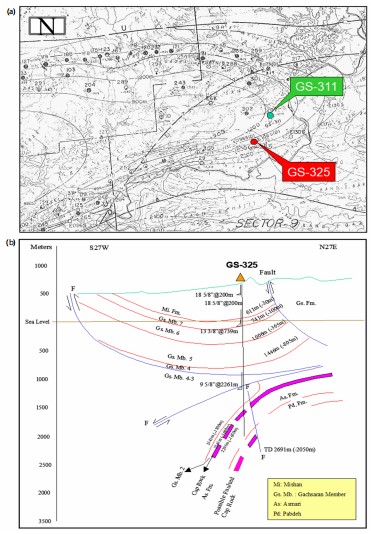
The strategic positioning of wells GS-311 and GS-325 within the Gachsaran Field has been instrumental in extracting crucial geological data. Each well underwent specific logging methodologies aimed at uncovering hidden reservoir characteristics or understanding unexpected geological anomalies. The GS-325's utilization of Oil-Based Mud Imager (OBMI) and Ultrasonic Borehole Imager (UBI) tools shed light on the unexpected thickness within the Asmari Formation, elucidating geological complexities. Moreover, the integration of advanced borehole imaging tools has significantly enhanced structural and geomechanical evaluations of the Asmari Formation, providing critical insights into anomalies encountered during drilling and ensuring a comprehensive understanding of these geological formations. This study aims to investigate the effectiveness of advanced borehole imaging tools in enhancing structural and geomechanical evaluations of the Asmari Formation, utilizing data from wells GS-311 and GS-325 in the Gachsaran Field.
MATERIALS AND METHODS
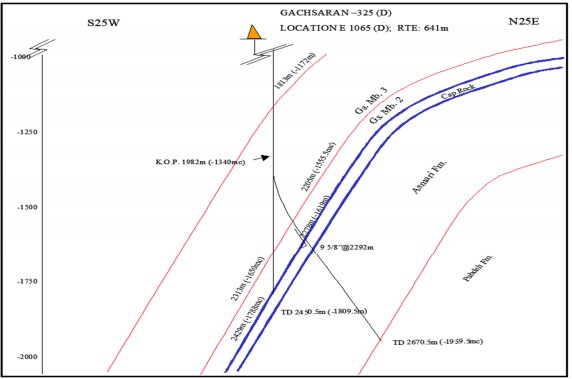
The GS-325 well was drilled at an inclination ranging from 19 to 28 degrees towards the NNE using an 8.5” bit, specifically targeting the evaluation of the Asmari Formation. In order to obtain a comprehensive understanding of the reservoir characteristics and surrounding structure, NISOC chose to acquire borehole images and a complete set of open-hole logs using oil-based mud (OBM). This involved employing a borehole-imaging tool combination referred to as OBMI/UBI, which facilitated the assessment of fracture characteristics and structural analysis.
Upon encountering unexpected geological formations during the drilling process, a decision was made to drill a sidetrack hole from GS-325. Subsequent image log analysis in GS-325 became part of a comprehensive study conducted between April, 2004 and June, 2004, with further in-depth analysis and integration of data from wells 325 and 311 performed in 2023. The primary objective of these endeavors was to elucidate the structural and reservoir characteristics of the Asmari Formation within the Gachsaran Field.
The strategic positioning of wells GS-311 and GS-325 within the Gachsaran Field has proven pivotal in gathering indispensable geological data. While GS-311 utilized Formation MicroScanner (FMS) technology in conjunction with Vertical Seismic Profile (VSP) results to reveal previously unnoticed aspects of the Asmari reservoir, GS-325 employed Oil-Based Mud Imager (OBMI) and Ultrasonic Borehole Imager (UBI) tools to investigate unexpected thickness within the Asmari Formation, thereby shedding light on geological complexities (Fig. 1a-b).
|
In the case of GS-325, the original drilling encountered cap rock at a significantly deeper depth than anticipated, prompting the decision to drill a sidetrack hole towards the NNE. This sidetrack hole intersected cap rock, Asmari and Pabdeh Formations and subsequent analysis using image logs was crucial in identifying the reasons behind the discrepancy in cap rock tops.
Data sets utilized
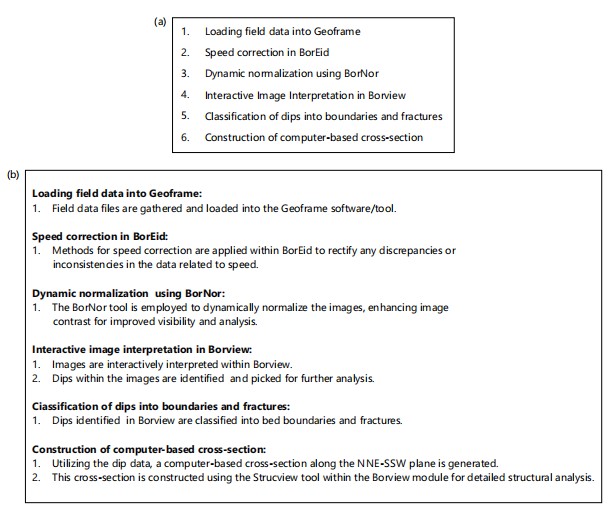
Study leveraged two primary datasets: The full set and OBMI-UBI log data sets, which were accessible through Geoframe software 2012 to ensure a comprehensive analysis, a particular focus was placed on enhancing the quality of the OBMI-UBI data through BorEid processing techniques.
|
Data enhancement: The OBMI-UBI data underwent a refinement process via BorEid processing methods. This step was integral in augmenting the data quality, aiming to mitigate inconsistencies and improve accuracy.
Log alignment and normalization: All petrophysical logs and associated images underwent a meticulous alignment process to a reference log. To further refine the images and ensure consistency, BorNor techniques were applied. This normalization process aimed to equalize and standardize images, ultimately enhancing the visualization of critical formation features.
Visual representation: The representation of image logs was optimized for clarity and precision. This involved a color-based distinction, where resistive units were vividly highlighted in bright colors, while lower resistivity conductive units were depicted in darker hues. This visual distinction facilitated easier identification and differentiation of distinct formations.
Dip selection and categorization: The interpretation phase commenced with a manual selection of dips employing sinusoidal techniques. This meticulous process was conducted on oriented images displayed at a scaled ratio of 1:20, minimizing the potential for human error. Once the dips were identified, they were meticulously categorized into two primary classifications: Bed boundaries and fractures, employing Borview for this purpose.
Cross-section construction: Utilizing the comprehensive dip data obtained, a computer-based cross-section was meticulously constructed. This cross-section was specifically oriented along the NNE-SSW plane, achieved through the utilization of strucview software. This computer-based approach ensured accuracy and precision in delineating geological structures. The combination of these steps allowed for a comprehensive analysis of the geological formations, providing valuable insights into bed boundaries, fractures and overall structural characteristics along the NNE-SSW plane (Fig. 2a-b).
RESULTS AND DISCUSSION
Exploring structural complexity within the Asmari reservoir
Unveiling insights: In carbonate sequences, the boundaries between layers or beds aren’t consistently clear-cut or flat due to various processes known as diagenesis. These processes alter the original sedimentary layers through things like chemical reactions, compaction and cementation, leading to irregular and indistinct boundaries. This complexity poses a challenge when using these boundaries to determine structural dip.
To overcome this challenge, when interpreting images from tools like OBMI (Oil-Based Mud Imager) or UBI (Ultrasonic Borehole Imager), geologists employ a method that involves interactive analysis using geological workstations. Instead of relying solely on the visual appearance of these boundaries, they compute the dips associated with them and classify them into two categories based on their characteristics.
The first category comprises dips corresponding to boundaries that appear sharp and exhibit a well-defined planar structure. These are considered high confidence dips because they suggest more reliable and clear layer boundaries, making them more suitable for structural dip determination.
Conversely, the second category involves dips related to boundaries that appear vague, uneven or lacking clear definition. These boundaries indicate surfaces that are less distinct and might not align with a straightforward structural dip. Therefore, these dips are categorized as low confidence, signifying the uncertainty or unreliability in determining structural dip from these particular boundaries.
The process involves analyzing bedding dips identified on the OBMI and UBI images obtained from a specific well under study. By applying this approach consistently, geologists can discern between more confidently determined structural dips and those derived from less distinct or uncertain bed boundaries within carbonate sequences. This classification helps in ensuring a more accurate interpretation of the structural characteristics of the geological formations being studied.
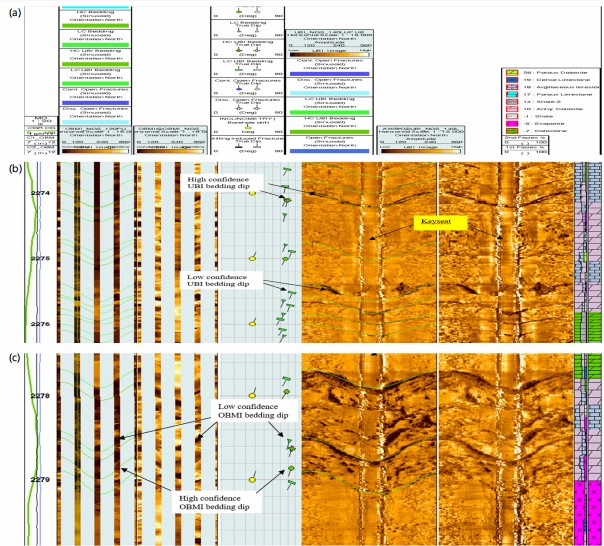
In the geological analysis, the examination of both electrical (OBMI) and acoustic (UBI amplitude) borehole images reveals distinct layering or bedding occurrences across the logged interval. These images distinctly showcase the presence of various layers or beds. Some of these layer contacts exhibit clear, sharply defined and planar boundaries, while others display more ambiguous and irregular connections.
The analysis discerns between two categories of layer or bed contacts based on their characteristics. The first type comprises contacts with distinct, well-defined boundaries, termed high confidence bedding dips. In contrast, the second type encompasses contacts with vague and uneven boundaries, labeled as low confidence bedding dips. Dips or inclinations, calculated from these different types of layer or bed boundaries are computed separately from both the UBI and OBMI images.
This separation into high confidence and low confidence bedding dips extends to the classification of these dips derived from the UBI and OBMI images, resulting in four distinct categories: High-confidence UBI bedding, low-confidence UBI bedding, high-confidence OBMI bedding and low-confidence OBMI bedding (Fig. 3a-c and Fig. 4).
|
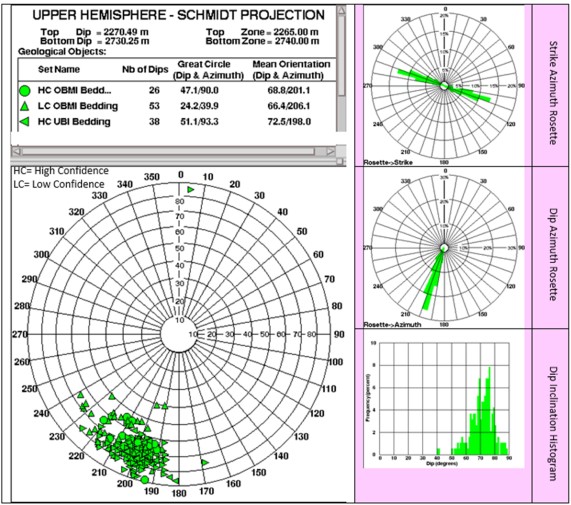
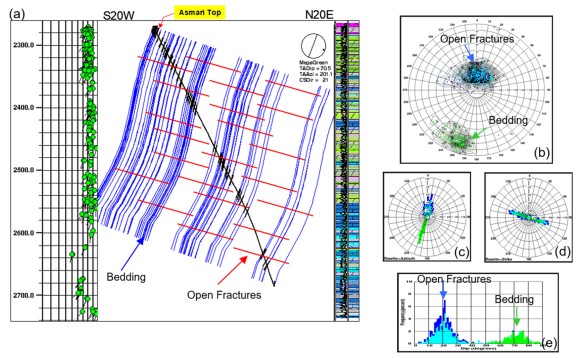
The dominant dip azimuth appears to be consistently around S20W, indicating the general direction in which the bedding layers are inclined. Regarding the dip magnitude, it seems there’s a variation along the depth profile. Here’s a breakdown based on description:
| • | Depth range 2270 to 2350 m: The dominant dip magnitude consistently hovers around 70 degrees. This suggests a relatively stable inclination angle for the bedding layers within this segment | |
| • | Depth range 2350 to 2603 m: There’s a gradual increase in dip magnitude, moving from 70 degrees to around 75 degrees. However, within this range, there’s some variability or scatter of about 10-15 degrees around this dominant value. This could indicate some geological variation or changes in the sedimentary layers | |
| • | Around 2635 m: The dip magnitude starts decreasing abruptly to 40 degrees, which is notably different from the trend observed in the previous segment. This sudden shift might indicate a change in the geological composition or structural features at this specific depth | |
| • | Around 2725 m: Following the dip decrease, there’s a subsequent increase in dip magnitude to an average value of 80 degrees. This rise might suggest a different geological setting or the reorientation of bedding layers |
|
The changes in dip magnitude at different depths likely reflect variations in sedimentary deposition, geological structures or other geological processes that have affected the orientation and inclination of the bedding layers.
Launch the characteristics of natural fractures in geological formations: Understanding whether the reservoir is fractured or not holds immense significance. If fractures exist, determining their nature-whether they’re open or closed-and assessing their intensity becomes crucial. Additionally, identifying if they occur as a single set or multiple sets and understanding the dominant strike orientation of these fractures, is equally pivotal. Addressing these queries is fundamental for geologists and reservoir engineers as it aids in optimizing oil production strategies9. However, relying solely on well-test analyses might not provide precise characterizations of fracture properties. Insufficient data on fracture intensity and the presence of deep-seated fractures significantly elevate the risk of unforeseen water production concerns10. Therefore, a thorough grasp of fracture attributes is crucial for efficient reservoir management and reducing production-related risks. Considering that compression-related tectonic structures often coincide with pressure solution features or older fractures that are frequently filled with calcite cement, it is anticipated that these structures will result in decreased permeability11.
|
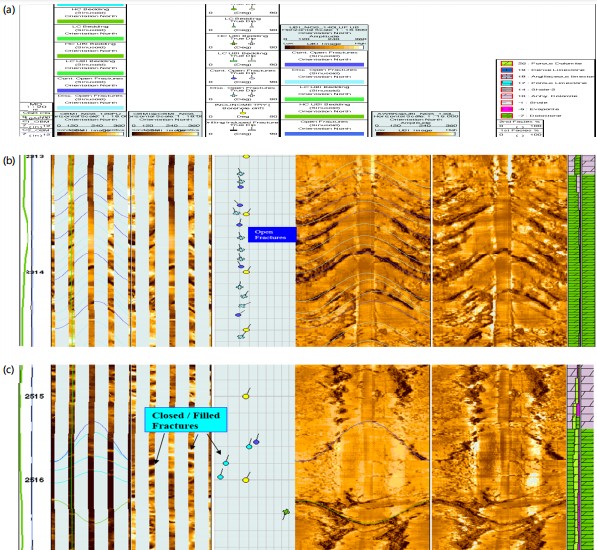
The OBMI and UBI images were employed to distinguish between open and closed fractures, showcasing distinct characteristics. The UBI predominantly detects open fractures, which manifest as resistive features on OBMI images. Fractures, depicted as linear formations with a dip often steeper than the structural dip, are observable on both OBMI and UBI images. Differentiating between open and closed fractures varies depending on the type of mud imaging tools employed-oil-based mud imaging (OBMI and UBI) versus water-based mud imaging (FMI and FMS). In OBMI images, both open fractures and those containing resistive substances like calcite and anhydrite display a similar resistive appearance. This similarity occurs because open fractures filled with oil-based mud exhibit a resistive characteristic, resembling those filled with minerals such as calcite and anhydrite. However, closed fractures, even if filled with such substances, can be distinguished from open fractures using UBI amplitude images. In UBI amplitude images, open fractures filled with oil-based mud experience a decrease in acoustic pulse amplitude, resulting in darker linear features, aiding in their differentiation (Fig. 5a-b).
Conversely, fractures filled with calcite or anhydrite do not impact the amplitude image significantly due to the similar amplitude ranges of the rock matrix and the filling material. Extensive fracturing is evident across the majority of the interval in this well, notably concentrated within the uppermost 30 m of the Asmari section. The majority of these fractures display low amplitude traces on UBI amplitude images and exhibit a resistive appearance on OBMI images, thereby classified as open fractures. These fractures are then subdivided into continuous-open and discontinuous-open categories, depending on the continuity observed in their low-amplitude traces on the acoustic amplitude images generated by UBI. Additionally, resistive fractures are sporadically discernible in specific areas on OBMI images. However, the absence of any indication of these fractures as open on the UBI amplitude image, which specifically detects open fractures, leads to their classification as closed or filled fractures. These fractures, exhibiting traces across all OBMI images, are termed continuous closed fractures (Fig. 5c).
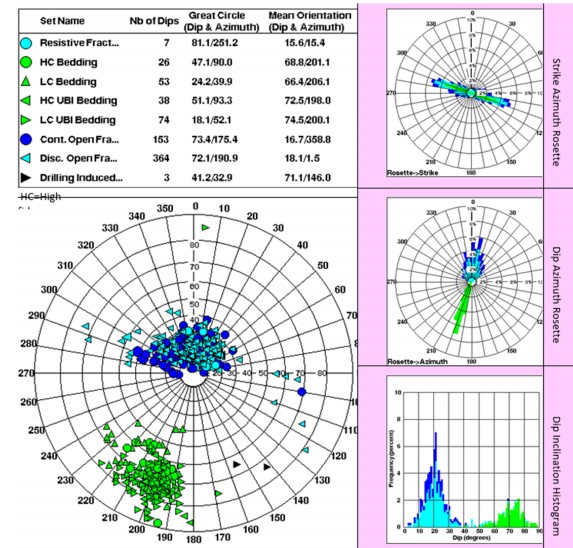
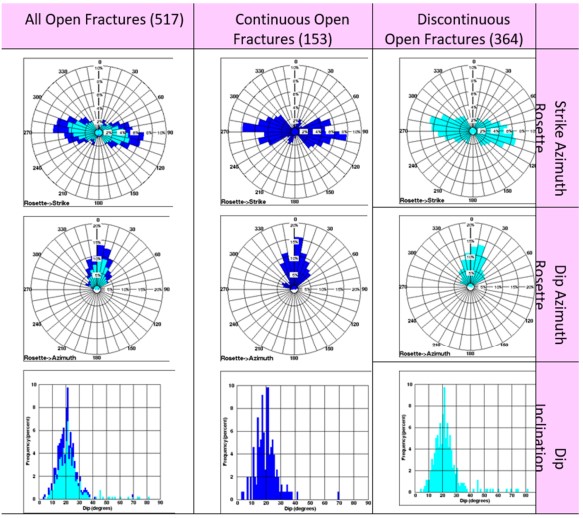
Exploring dip and strike patterns of geological fractures: In the Schmidt stereo net’s upper hemisphere and the dip pole contour diagram, a dense concentration of both continuous and discontinuous open fractures is observed predominantly clustered around the North and NNE directions, close to the 20 degree inclination circle. These fractures exhibit a diverse range of dip azimuths, contributing to a widespread pattern.
Examining the dip azimuth rosettes, the discontinuous open fractures prominently display an azimuth clustering around N10E, spanning a range of 40-50 degrees on either side. On the strike azimuth rosette, these fractures demonstrate a comparable dispersion, with a prevailing strike azimuth between N80W and S80E. Their dip inclination varies widely, yet the majority fall within the 10 to 30 degree range, with a dominant inclination at 21 degrees. As for the continuous open fractures, their primary dip inclination tends towards N05E, diverging by approximately 40 degrees in either direction. They predominantly strike between N85W and S85E with a similar spread in azimuth. Additionally, among the continuous fractures, a secondary minor set is discernible, striking dominantly between N35E and S35W while dipping towards N65W. These fractures also display a wide range of dip inclinations, mostly falling within 10 to 29 degrees, with 21 degrees as the prevailing inclination. In contrast, a limited number of closed fractures, totaling seven, tend to dip either towards N15E or N07W, spanning a modest inclination range of 3 to 20 degrees (Fig. 6 and 7).
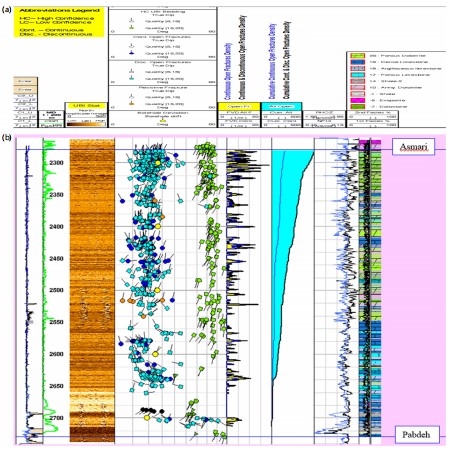
Assessing the frequency and density of fractures within geological structures: With the exception of a brief span between 2642 and 2700 m, fractures are widely distributed across the region. These fractures manifest predominantly in clusters, typically spanning 5 to 10 m in length. Throughout the entire interval, these clusters exhibit a pattern, occurring at consistent intervals of 10 to 25 m. Notably, the uppermost 30 m of the Asmari Formation harbor the most concentrated density of fractures per meter. This section boasts the highest occurrence of fractures compared to other segments, signifying an elevated density in this specific region.
The analysis operates under the premise that solely open fractures play a role in productivity. It establishes a predictive profile for the Asmari carbonate formations encountered by the examined well by amalgamating fracture density across the fractured span. This approach allows for the identification of the productive potential within this geological formation. In accordance with this analysis, the uppermost 30 m of the formation exhibit a notably high level of productivity (Fig. 8a-b).
Resolving structural complexity in the Asmari fractured reservoir: Initial geological data, specifically dip measurements, was thoroughly examined. A decision was made to focus on constructing a computer-based cross-section along the NNE-SSW plane due to the significance of the observed data. Utilizing advanced software or tools, a detailed cross-sectional representation was generated. The resulting cross-section vividly displayed a distinct geological feature: A steep southern limb. Within this limb, a specific structural element, referred to as a flexor, was identified in the lower section. This flexor indicated a bending or folding in the geological layers (Fig. 9a).
|
Among the data from various wells, GS-325 stood out due to its notably steeper dip. This heightened angle of the dip at GS-325 raised intriguing geological implications. It was postulated that such a pronounced steepness in the dip could signify proximity to a significant geological feature, particularly a sizable thrust fault in the area.
Building upon the observation from GS-325's dip, a hypothesis emerged. The steeper nature of the dip at GS-325 led to speculation that the target depth (TD) for drilling a well might be closer to this inferred big thrust fault. The reasoning behind this hypothesis lay in the geological understanding that steep dips often indicate structural complexities or proximity to major faults.
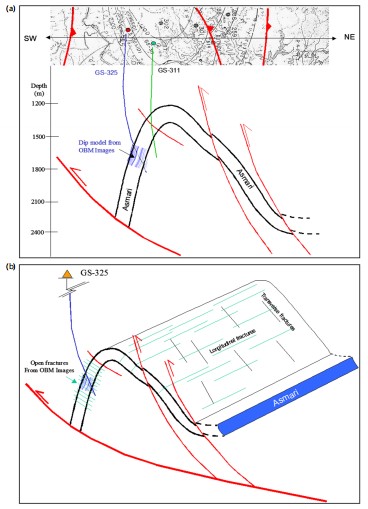
To visually represent this hypothesis and geological interpretation, a schematic cross-section was meticulously crafted. This schematic was constructed along the NE-SW line and integrated dip data specifically from the wells GS-311 and GS-325. The intention behind this illustration was to provide a clear visual narrative of the relationship between the observed geological features and the proposed proximity of the TD to the significant thrust fault, as suggested by the steeper dip at GS-325.
|
The construction of the computer-based cross-section along the NNE-SSW plane revealed compelling geological features, notably a steep southern limb with a distinct flexor. The noteworthy steeper dip at GS-325 sparked the hypothesis that the TD might be closer to a significant thrust fault. This inference was strengthened by the intricate schematic cross-section, showcasing the relationship between the dip data from GS-311 and GS-325 and highlighting the potential implications for good drilling in this geological contex (Fig. 9a-e).
Validating structural complexity findings in the Asmari fractured reservoir: In studying the Asmari fractured reservoir at the Gachsaran Field, the investigation heavily relied on optical borehole televiewer (OBMI) and ultrasonic borehole imager (UBI) images from well GS-325, along with Formation MicroScanner (FMS) images from GS-311. These imaging techniques provided essential dip data concerning bedding, faults and fractures, enabling precise location determination of GS-325 within the Asmari reservoir and a profound understanding of structural complexities in that specific part of the field.
Following the drilling of the primary and side-track holes, the National Iranian South Oil Company (NISOC) constructed a structural model based on interpretative insights drawn from OBMI-UBI images, indicating a potentially high structural dip. This inference was drawn from the deeper position of the cap rock in the primary hole and the unexpected thickness of the Asmari Formation in the side-track hole.
|
Analyzing changes in dip magnitude across depth intervals yielded significant insights into subsurface geological conditions, revealing a steep southern limb with a noticeable flexure in its lower section, particularly evident at GS-325.
The integration of dip measurements derived from various imaging techniques played a critical role in comprehending intricate structural aspects surrounding GS-311 and GS-325. By incorporating this data into cross-sectional representations, invaluable insights into the geological framework and structural configurations within the Gachsaran Field were obtained (Fig. 10a-b).
The resulting visualization serves as an indispensable tool for interpreting and making informed decisions concerning well placement. It provides a clear visual representation aiding in understanding geological complexities, thus optimizing the drilling process while considering potential challenges posed by fault structures in the subsurface. Ultimately, these findings serve as a comprehensive guide for resource assessment and exploration strategies within the Asmari fractured reservoir.
|
The validated structural complexity findings offer a foundation for informed decision-making and strategy formulation in the exploration and development of resources within the Asmari fractured reservoir. They cover the way for a more comprehensive understanding of the subsurface, enabling effective resource assessment and facilitating strategic planning for future exploration endeavors.
The structural model presented in Fig. 11, developed by NISOC post-drilling, reveals significant observations regarding the geological structure encountered. The deeper placement of the cap rock in the main hole indicates a heightened structural dip, potentially pointing to geological complexities. Additionally, the larger-than-expected thickness of the Asmari Formation in the side-track hole highlights unforeseen geological variations, suggesting potential complexities that weren’t initially accounted for during the drilling operations.
Results findings correlation: The findings from the analysis of the Asmari Formation in well GS-325 align with or complement several recent publications in the field of geological exploration and reservoir characterization.
Exploring structural complexity within the Asmari reservoir
Unveiling insights: The methodology described in this publication, which involves categorizing bedding dips into high and low-confidence categories based on boundary characteristics, is consistent with the approach used in the current study to analyze structural complexities within the Asmari Formation.
Launch the characteristics of natural fractures in geological formations: The utilization of OBMI and UBI images to distinguish between open and closed fractures resonates with the methodology employed in the current study to assess fracture properties within the Asmari Formation.
|
Exploring dip and strike patterns of geological fractures: The analysis of fracture dip and strike patterns in this publication complements the investigation of fracture attributes in the current study, providing further insights into the distribution and orientation of fractures within the reservoir.
Assessing the frequency and density of fractures within geological structures: The assessment of fracture density and distribution described in this publication corroborates the findings of the current study, particularly regarding the prevalence of fractures within specific intervals of the Asmari Formation.
|
Resolving structural complexity in the Asmari fractured reservoir: The hypothesis regarding the proximity of the target depth to a significant thrust fault, based on the steeper dip observed in well GS-325, aligns with the interpretation of structural complexities in the current study, emphasizing the importance of understanding geological features for optimal well placement.
Validating structural complexity findings in the Asmari fractured reservoir: The integration of dip measurements from various imaging techniques and the construction of structural models described in this publication validates the approach adopted in the current study, reinforcing the significance of analyzing borehole images for understanding subsurface geological structures.
Overall, the findings from the analysis of well GS-325 in the current study are consistent with recent literature in the field, providing valuable insights into the structural complexities and fracture characteristics of the Asmari Formation within the Gachsaran Field.
It indicates a high structural dip as indicated by the deeper location of the cap rock in the main hole and the larger than expected thickness of the Asmari Formation in the side-track hole.
Future research directions for the Asmari fault and fracture systems encompass several crucial avenues:
Advancing structural understanding: Delving deeper into fault systems and fractures using advanced imaging methods could refine the reservoir’s characterization.
Holistic data integration: Beyond geological logs, incorporating diverse data like geochemical analysis and machine learning can offer a comprehensive view of the reservoir’s behavior.
Long-term reservoir predictions: Modeling the reservoir’s behavior over time considering production, geological shifts and fluid dynamics can offer insights into its long-term evolution.
Environmental sustainability: Exploring sustainable extraction methods and mitigating environmental impacts from extensive drilling are vital considerations.
Application and validation: Applying research insights to real-world scenarios through field experiments can validate findings and enhance practical applications.
Collaborative research: Partnering with industry, academia and research organizations can leverage diverse expertise for accelerated innovations.
Technology integration: Staying updated on technological advancements in imaging, sensing and analytics can offer new methodologies to unravel reservoir complexities.
These areas offer potential for expanding knowledge in fractured carbonate reservoirs, promising more accurate predictions, sustainable practices and improved reservoir management techniques.
CONCLUSION
In summary, the computer-generated cross-section along the NNE-SSW plane uncovered compelling geological features, notably a steep southern limb and a distinct flexor. The steeper dip at GS-325 suggested a possible thrust fault, reinforced by the relationship between GS-311 and GS-325. This visualization now stands as a crucial tool for informed decision-making in well placement, offering insights into subsurface complexities, especially fault structures. These findings serve as a comprehensive guide for resource assessment and exploration strategies within the Asmari fractured reservoir, paving the way for better-informed exploration and development initiatives. The structural model’s observations, including the deeper cap rock placement and unexpected Asmari Formation thickness, point toward potential geological complexities that were previously unaccounted for during drilling operations.
SIGNIFICANCE STATEMENT
This study has adeptly tackled and resolved intricate structural complexities, culminating in the precise identification of optimal well placement within the Asmari reservoir. This achievement holds substantial advantages, promising cost efficiencies in drilling ventures and opening avenues for additional well installations in the field. Furthermore, the outcomes of this research will stand as an invaluable asset for researchers, facilitating the exploration of hitherto unexplored structural intricacies within the reservoir. The methodologies employed and the insights gleaned from this study are poised to establish a benchmark workflow applicable to analogous fractured carbonate reservoirs. This pioneering step is set to propel advancements in reservoir characterization and development, providing a framework of guidance and best practices for future endeavors in similar geological terrains.
REFERENCES
- Movahed, Z., R. Junin, H.A. Bakhtiari, Z. Safarkhanlou, A.A. Movahed and M. Alizadeh, 2015. Introduction of sealing fault in Asmari reservoir by using FMI and RFT in one of the Iranian naturally fractured oil fields. Arabian J. Geosci., 8: 10919-10936.
- Nelson, R.A., 2001. Geologic Analysis of Naturally Fractured Reservoirs. 2nd Edn., Gulf Professional Publishing, London, United Kingdom, ISBN: 978-0-88415-317-7, Pages: 332.
- Movahed, Z., F. Aghajari and A.A. Movahed, 2023. Characterization of reservoir by using geological, reservoir and core data. J. Appl. Sci., 23: 34-46.
- Alizadeh, M., Z. Movahed and R.B. Junin, 2015. Reservoir heterogeneity analysis using formation micro imager log and the other geological logs. Environ. Sci.: Indian J., 11: 51-56.
- Alavi, M., 2004. Regional stratigraphy of the Zagros fold-thrust belt of Iran and its proforeland evolution. Am. J. Sci., 304: 1-20.
- Yang, J., X. Gou, N. Hilmi, R. Xia and X. Sun et al., 2011. An integrated approach for fracture characterization and prediction using FMI logs, post‐stack seismic attributes and pre‐stack anisotropy-A case study in Tishrine West Oilfield, Northeast Syria. SEG Tech. Program Expanded Abstr., 2011: 1814-1818.
- Movahed, Z., M. Ashraf and A.A. Movahed, 2023. Assessment of fracture density distribution from image logs for sensitivity analysis in the Asmari fractured reservoir. Earth Sci. Hum. Constr., 3: 99-118.
- Delleur, J.W., 2006. The Handbook of Groundwater Engineering. 2nd Edn., Crc Press, United States, ISBN-13: 978-0-8493-4316-2, Pages: 1320.
- Shariatinia, Z., M. Haghighi, S. Feiznia, D. Hall, G. Levresse, A.M. Dehghani and M. Rashidi, 2013. Paleofluid analysis from fracture-fill cements in the Asmari limestones of the Kuh-I-Mond field, SW Zagros, Iran. Arabian J. Geosci., 6: 2539-2556.
- Movahed, Z., R. Junin and P. Jeffreys, 2014. Evaluate the borehole condition to reduce drilling risk and avoid potential well bore damages by using image logs. J. Pet. Sci. Eng., 122: 318-330.
- Z. Movahed, R. Junin & H. Amiri Bakhtiari, 2015. The Effect of Tar on the Petrophysical Analysis of FMI in Asmari Fractured Reservoir. In: ICIPEG 2014, Awang, M., B.M. Negash, N.A.M. Akhir and L.A. Lubis (Eds.), Springer, Singapore, ISBN: 978-981-287-368-2, pp: 239-245.
How to Cite this paper?
APA-7 Style
Movahed,
Z. (2024). Deciphering the Asmari Formation: Advanced Obmi and Petrophysical Log Analysis for Fractured Reservoir Assessment. Asian Science Bulletin, 2(4), 463-479. https://doi.org/10.3923/asb.2024.463.479
ACS Style
Movahed,
Z. Deciphering the Asmari Formation: Advanced Obmi and Petrophysical Log Analysis for Fractured Reservoir Assessment. Asian Sci. Bul 2024, 2, 463-479. https://doi.org/10.3923/asb.2024.463.479
AMA Style
Movahed
Z. Deciphering the Asmari Formation: Advanced Obmi and Petrophysical Log Analysis for Fractured Reservoir Assessment. Asian Science Bulletin. 2024; 2(4): 463-479. https://doi.org/10.3923/asb.2024.463.479
Chicago/Turabian Style
Movahed, Zohreh.
2024. "Deciphering the Asmari Formation: Advanced Obmi and Petrophysical Log Analysis for Fractured Reservoir Assessment" Asian Science Bulletin 2, no. 4: 463-479. https://doi.org/10.3923/asb.2024.463.479

This work is licensed under a Creative Commons Attribution 4.0 International License.