
Evaluating the Asmari Fractured Reservoir: Findings from FMI and Petrophysical Logging
-
Zohreh Movahed


Springer, Alzare, Toronto, Canada
| Received 09 Mar, 2024 |
Accepted 31 May, 2024 |
Published 31 Dec, 2024 |
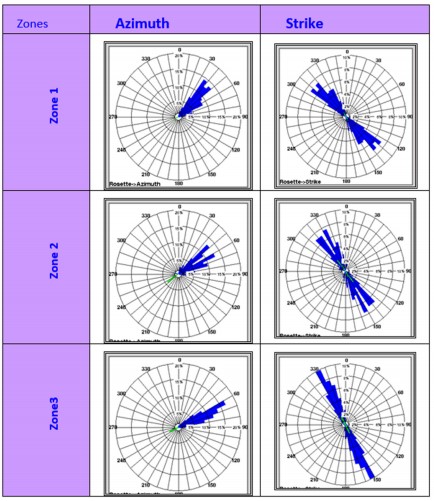
Background and Objective: The Asmari Formation presents substantial challenges in reservoir management due to its structural complexities. Traditional core sampling methods fall short of accurately characterizing the fractured regions, impacting the efficacy of reservoir exploitation. Current study aims to enhance the understanding of the Asmari reservoir’s structural and fracture complexities to improve well-test analyses and establish a detailed structural model for fracture characterization. Materials and Methods: The Formation Micro Imager (FMI) and geological logs utilized in well ZE-15, located within the Asmari Formation, for our experimental design. The FMI data, collected between depths of 4374 and 4640 m, was instrumental in assessing structural dips and mapping natural fractures. This approach facilitated a comprehensive analysis of fracture properties and structural orientation, incorporating statistical analyses to interpret the data accurately. Results: The FMI logging revealed a consistent structural dip of 33 degrees towards S62W across the Asmari Formation. Three main fracture zones were identified at depths of 4377-4459 m (Zone 1), 4459-4480 m (Zone 2) and 4480-4574 m (Zone 3), displaying a predominant WNW-ESE strike direction. This orientation correlates with the Zeloi structure’s longitudinal alignment and the bedding strike. Further, elliptical borehole shapes observed in FMI images and caliper readings suggested the direction of minimum and maximum horizontal stresses, providing insights into the stress orientations affecting the formation. Conclusion: The current study successfully delineated the structural and fracture complexities within the Asmari reservoir, offering crucial insights into its stress orientations and natural fracture systems. This enhanced understanding is vital for optimizing reservoir exploitation strategies and improving recovery rates from this challenging geological formation.
INTRODUCTION
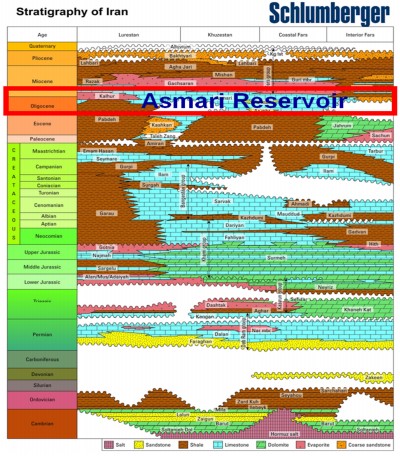
Carbonate formations are of significant importance, containing nearly half of the world’s primary petroleum reserves. The Asmari Formation, located in the Zagros foreland basin and dating back to the Oligocene-Miocene era, is composed of a variety of sedimentary rocks including limestone, dolomitic limestone, dolomite and argillaceous limestone, along with anhydrite layers referred to as the Kalhur Member and sandstone layers known as the Ahwaz Member. This formation is notable for being the first in Iran to produce significant quantities of oil, with its shallow-water limestone from the Oligocene-Miocene period lying atop the Pabdeh Formation, representing a crucial economic breakthrough1.
The Asmari Formation in southwest Iran is a major contributor to oil production due to its high production capacity. Understanding the lithology of the Asmari Formation is crucial for the oil and gas industry as it aids in identifying potential reservoir zones, assessing rock properties and determining the feasibility of oil extraction and production.
Schlumberger, a leading provider of technology to the oil and gas industry, likely compiled this lithological depiction through extensive geological surveys, data collection and analysis conducted across the Iranian region where the Asmari Formation is present.
Traditional methods of evaluating carbonate formations rely on resistivity and porosity logs, but their correlation with hydrocarbon production has been inconsistent. Surprisingly, intervals with low porosity have yielded good production, while zones with higher porosity haven’t. Fracture permeability, besides matrix porosity, significantly impacts Asmari’s high production. Despite standard porosity logs underestimating production, recent advancements in evaluating carbonates have revolutionized understanding and optimizing their production. This has made efficiently producing from carbonate reservoirs a top industry priority2.
Fractured reservoirs, a unique class among hydrocarbon reservoirs, typically exhibit irregular distributions of porosity and permeability. They can vary greatly in thickness and while their porosity is primarily secondary, their hydrocarbon content isn’t consistently uniform. Evaluating their potential often defies conventional open-hole logs due to these irregularities. Fractures play a pivotal role in governing the behavior of such reservoirs3, acting as conduits for petroleum migration and potentially leading to high-production zones with permeability exceeding 10,000 millidarcies if these fractures remain open. Consequently, the study of fractures within the Asmari reservoir remains a significant focus4. These fractures aid fluid circulation, fostering the dissolution of specific carbonate elements like allochems and high magnesium carbonates. Conversely, fine-grained carbonate sections, less cemented, experience minimal porosity enhancement through cement dissolution5.
The Formation Micro Scanner (FMI) is key in characterizing permeability in complex Asmari carbonate formations because of its detailed coverage and high-resolution capabilities. This tool excels in identifying subtle variations in rock fabric caused by deposition or diagenesis. Techniques like FMI and FMS are especially useful for evaluating permeability in carbonates with vuggy or moldic textures. Traditional core analysis often misses accurate permeability assessments due to difficulties in recovering representative samples6.
Coring involves extracting intact samples that are later analyzed in labs using various techniques based on desired data types7. Well testing often provides restricted insights and depends on assumptions, particularly when estimating permeability height product (KH) and hydrocarbon volumes. Borehole image logs are essential for precisely characterizing thinly laminated reservoirs, which is crucial for the success of field development8.
The well ZE-15 was drilled through the Asmari Formation in the Zeloi Field using a water-based mud system. It reached a maximum deviation of 8.77 degrees, hitting a total depth of 4640m with an 8.375-inch bit. The Asmari Formation, known for its reservoir potential, was the targeted formation. Various logging tools, including PEX (TLD, CNL), HRLA, NGT, Sonic and Full-bore-formation Micro Imager (FMI), were employed to evaluate structural dip and characterize fractures across the reservoir section.
The objective of current study is to employ a multidisciplinary approach to accurately characterize the structural and lithological features of the Asmari Formation. By leveraging the latest in logging and imaging technology to enhance our understanding of its reservoir properties, ultimately facilitating more effective exploration and production strategies within these complex carbonate systems.
MATERIALS AND METHODS
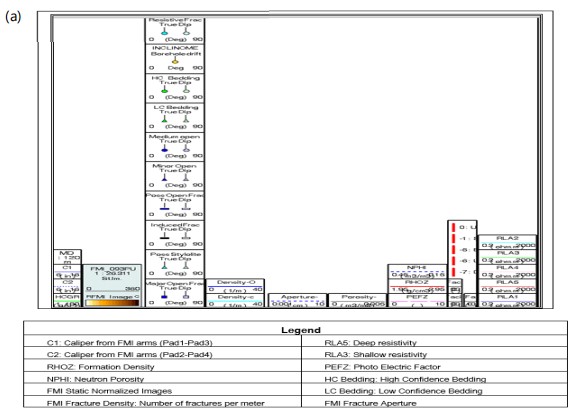
The drilling of ZE-15 aimed to evaluate the Asmari Formation in the Zeloi Field. It was drilled with an 8.375-inch bit, reaching a maximum deviation of 8.77 degrees and commenced on August 18th, 2008, utilizing a water-based mud system. In addition to traditional open hole logging methods (TLD-MCFL-HRLA-Sonic), the process involved using a Formation Micro Imager (FMI) to log the interval from 4374 to 4640 m on the same date. The main objective of acquiring FMI data was to assess structural dip and identify natural fractures within the Asmari Formation. The thorough logging and imaging of ZE-15, incorporating PEX (TLD, CNL), HRLA, NGT, Sonic and Full-bore-formation Micro Imager (FMI), aimed to conduct an extensive analysis of structural dip and fracture characteristics within the Asmari carbonates. This study encompasses structural analysis, fracture characterization and in-situ stress analysis, with detailed tables documenting dipping features and their attributes (Fig. 1).
|
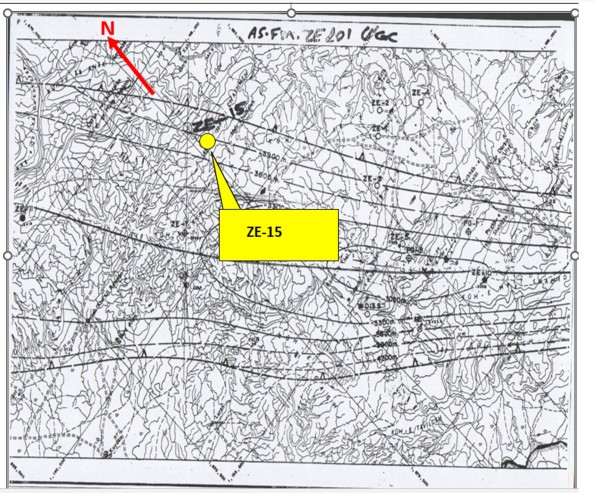
Figures provided by Schlumberger offer valuable reference material for geologists, petroleum engineers and researchers involved in the exploration and exploitation of hydrocarbon reserves within the Asmari Formation in Iran. The Zeloi Field holds significant importance within Iran’s oil and gas industry, serving as a focal point for exploration and potential extraction activities.
The map sourced from the NIOC South UGC provides detailed geographic information, aiding professionals in strategic planning, well positioning and decision-making processes related to hydrocarbon exploration and extraction within the Zeloi Field. This map is an indispensable tool for optimizing resource utilization and operational efficiency within the field, offering insights into spatial layout, topographical features and subsurface characteristics (Fig. 2).
The methodology utilized in this study involved the examination of various datasets and the evaluation of data quality, followed by specific considerations related to borehole condition, formation characteristics and tool performance. Here’s a more detailed breakdown.
Data used: Electrical Borehole Imaging (FMI) and Sonic-HRLA-TLD-MCFL logs spanning depths from 4374 to 4640 m were employed. Additional logs included TLD-MCFL-CNL-NGS spanning the same depth range. Formation tops were provided by the client and segmented into distinct zones from 4347 to 4662 m within the Asmari Formation.
|
Image processing: Before interpreting features and evaluating formations using the images, the FMS/FMI data undergo processing to address several potential factors affecting image quality. These factors encompass variations in tool speed concerning drill pipes (in the case of pipe-conveyed logging) or cable speed, tool sticking and EMEX variation. Additionally, for improved clarity of formation features, images are equalized and normalized.
Image resistivity calibration: Since the current released from the FMS/FMI into the formation is not suitable for quantitative analysis of formation features, the FMI resistivity/conductivity requires calibration. This calibration is achieved by comparing it with environmentally corrected shallow laterolog (LLS, HLLS, or RLA2) or spherically focused log (SFLU). The resulting calibrated FMI images are then utilized for subsequent analysis involving formation heterogeneity, permeability assessment, porosity evaluation and classification of lithofacies/morpho facies.
Depth matching: Due to differences in sampling rates, logging speeds and potential tool sticking, open-hole logs and images can be obtained at varying depths and times. Consequently, these variations might cause each set of logs to be misaligned with others by different amounts. Hence, as a standard practice, all logs and images are aligned to a reference log before conducting any analysis of the data. In the recent well, the FMI images were consistently offset from their actual depth compared to open hole logs due to differential sticking in certain intervals. To address this, the FMI images were adjusted by a constant 0.35 m to align them with the most comprehensive logs (resistivity and porosity).
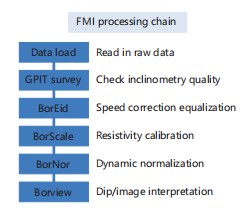
Data processing: Within this visualization, there is a specific flowchart that outlines the processing chain employed for handling the Formation Micro-Imager (FMI) images. This flowchart details the specific steps and procedures utilized in the processing of FMI images, offering a clear understanding of the methodology employed in this crucial aspect of the research. The field data files were brought into the computer system through the Data Load module of Geoframe Software 2012. Standard speed correction techniques in BorEid were employed as usual. Additionally, optional calibration via BorScale was used to synchronize image data with shallow logs such as HRLA (resistivity curve), whereas BorNor dynamically standardized images to improve contrast.
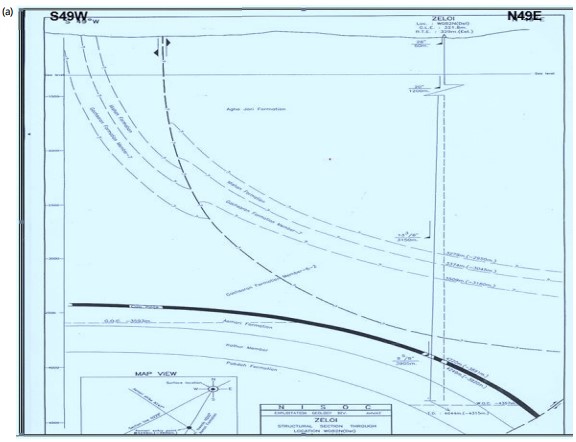
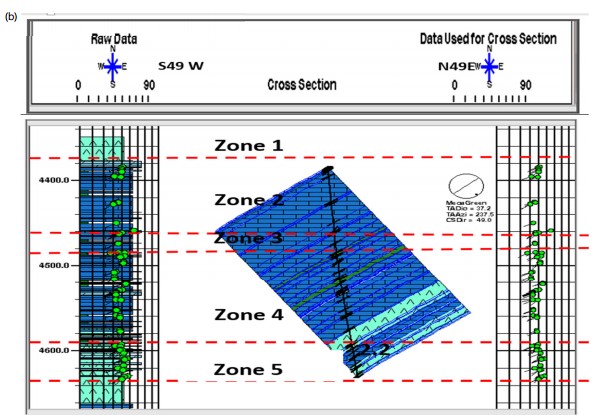
Interpretation approach: Initial interpretation involved hand-picking dips using sinusoid techniques on oriented images presented at 1:20 or 1:10 scales in Borview for improved visualization of geological features. Subsequently, dips were classified into bed boundaries and fractures. Based on structural dip data, a computer-based cross-section along the NNE-SSW plane was constructed using Strucview. This methodology combined data assessment, quality evaluation and interpretative techniques to derive geological insights within the specified depth range, addressing challenges posed by varying borehole conditions and formation complexities (Fig. 3).
|
RESULTS AND DISCUSSION
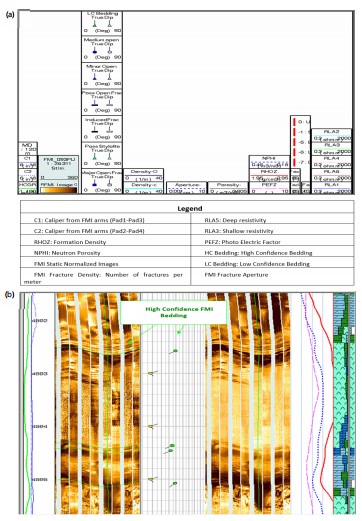
Examination of structural analysis: The Formation Micro-Imager (FMI) borehole images have provided valuable insights into the stratigraphy of the logged interval, revealing distinct layering or bedding patterns evident in Fig. 4. Within these observations, some layer or bed contacts exhibit clear, well-defined and planar characteristics. In contrast, others display irregular and indistinct boundaries, as depicted in Fig. 4.
|
| Table 1: | Glossary of abbreviations used in this report | |||
| Glossary | |||
| FMI | Formation micro imager | ||
| GPIT | General purpose inclinometry tool | DEVI | Borehole deviation angle (deg) |
| HAZI | Borehole deviation azimuth (deg) | P1MI | Pad 1 azimuth (deg) |
| LQC | Low quality control | BS | Bit size |
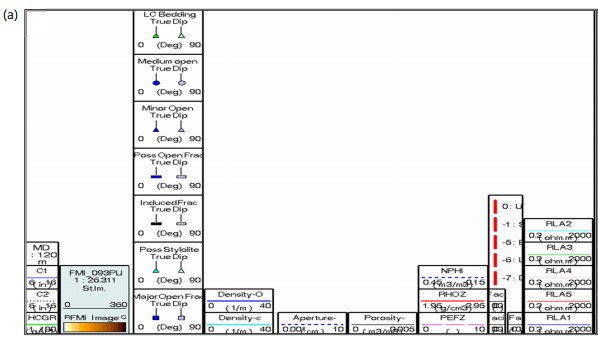
| C1 | Caliper pair 1-3 | C2 | Caliper pair 2-4 |
| CS | Cable speed | PP | Pad pressure |
| TENS | Tension | EMEX | Measurement control voltage |
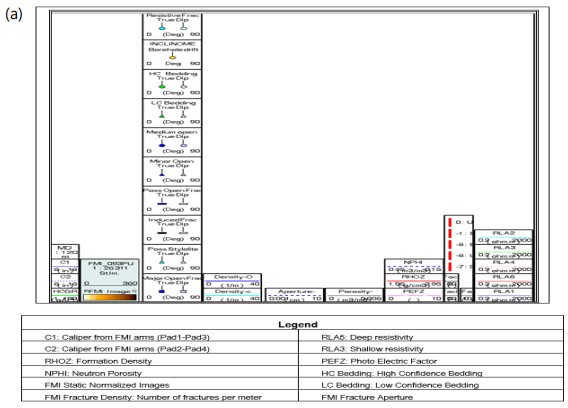
| RHOZ | Formation density | NPHI | Neutron porosity |
| PEFZ | Photo electric factor | GR | Gamma ray |
| HCGR | Gamma ray (corrected) | ||
| RLA3 | Shallow resistivity | RLA5 | Deep resistivity |
| Dip classification | |||
| Low confidence FMI bleeding | Medium open fracture | ||
| Low confidence FMI bleeding | Minor open fracture | ||
| Possible open fracture | Major open fracture | ||
| Images: | |||
| Static | Fixed window normalization | Dynamic | Sliding window normalization (0.6 m) |
| Fracture density | Number of fractures per meter | Fracture aperture | |
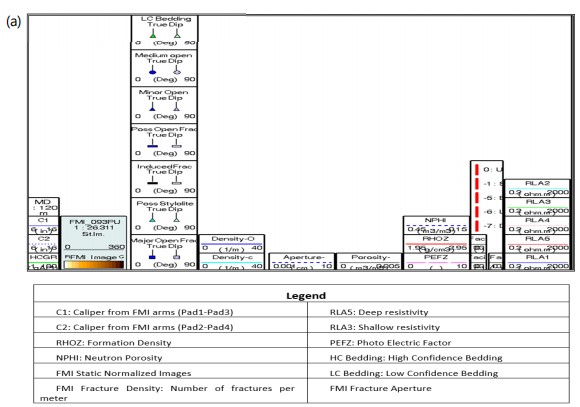
| The table labeled "Glossary of Abbreviations Used in This Report" serves as a reference guide to decode and understand the various abbreviations utilized throughout the document. Its purpose is to offer readers a quick way to grasp the meanings behind these shortened forms of words or phrases | |||
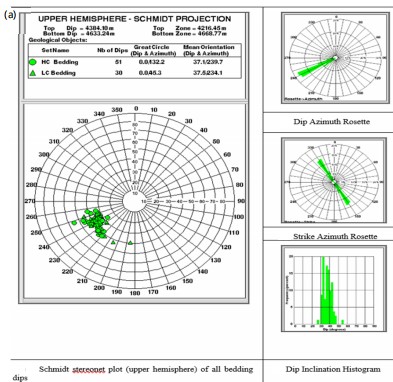
To categorize these observations effectively, dips were computed separately based on the two types of layer or bed boundaries identified. The first type, featuring well-defined and sharp contacts, led to the computation of what we term "High Confidence Bedding Dips." Conversely, the uneven and vague boundaries resulted in the computation of "Low Confidence Bedding Dips." This classification enabled the differentiation between confidently determined bedding dips and those with a lower level of certainty based on the clarity of boundaries observed within the FMI images (Fig. 4 a-b). The statistical analysis of each dip type is detailed in Fig. 4, 5 and 6, providing a comprehensive overview of the distribution and characteristics of the high-confidence and low-confidence bedding dips computed from the FMI images. The following table (Table 1) gives a glossary of abbreviations used in this study.
The table labeled "Glossary of Abbreviations Used in This Report" serves as a reference guide to decode and understand the various abbreviations utilized throughout the document. Its purpose is to offer readers a quick way to grasp the meanings behind these shortened forms of words or phrases.
The interpretation of both sets of bedding dips derived from the Formation Micro-Imager (FMI) images reveals consistent dominant dip azimuths and strike directions. Specifically, they demonstrate a prevailing dip azimuth of S62W and a strike ranging between N28W to S28E. However, the variation lies in the spread of the dip magnitudes observed within these interpretations. When all the bedding dips are consolidated into one continuous dip plot, it indicates that a dip magnitude in the range of 30 to 40 degrees is the predominant structural dip within the depth interval spanning from 4374 to 4640 m. This consolidated plot offers a comprehensive view, highlighting the prevalent structural dip magnitude observed across the studied interval. However, it’s essential to note the presence of local variations in the dip magnitudes. These variations, depicted in Fig. 5, showcase deviations or fluctuations from the predominant 30-40-degree range within localized sections of the interval. These variations in dip magnitude underscore the complex nature of the geological structure within this depth range, indicating localized differences in structural orientations or geological features that influence the observed dip angles.
The variations observed in dip azimuths within the Asmari Formation can be attributed to several contributing factors. Firstly, the sedimentary structure of the Asmari Formation is inherently complex, primarily due to diagenetic processes commonly encountered in carbonate sequences.
|
|
These processes encompass a range of geological alterations occurring over time, including mineral transformations, cementation and the dissolution of carbonate minerals. Such intricate alterations often lead to the formation of diverse structures and variations in the bedding orientations, contributing to the observed variations in dip azimuths. Then, the proximity of the study well to a potential fault zone could significantly influence the variations in dip angles. The high dip inclination observed in this context, possibly associated with the nearby fault, holds the potential to introduce variations in the dip angles recorded within the formation. Fault zones often introduce structural complexities within geological formations, leading to localized disturbances or alterations in the orientations of bedding planes or structural elements. This proximity to a fault zone might consequently contribute to the observed deviations or fluctuations in dip azimuths, highlighting the influence of localized structural features on the geological characteristics observed within the Asmari Formation.
The considerable variations observed in bedding dip and strike trends present challenges in identifying a clear and consistent major structural trend within the geological formation. These fluctuations and variations often obscure the identification of a predominant structural orientation. One notable characteristic is the generally high inclinations of dip angles, ranging widely between 26 to 56 degrees across the studied interval. This broad spectrum in dip inclinations adds complexity to the structural analysis and interpretation within the formation.
The extensive spread in dip azimuths observed within distinct structural zones could potentially be attributed to the existence of diagenetic variations within the limestone formations. Diagenesis, encompassing a range of processes such as mineral alteration, cementation and dissolution, introduces heterogeneities and complexities within carbonate sequences like limestone. These variations resulting from diagenetic processes can lead to inconsistencies and variations in the orientations of bedding planes or structural elements, contributing to the diverse spread in dip azimuths observed. Furthermore, the proximity of the study area to a potential fault zone might also influence the wide range of dip azimuths. Being near a fault zone introduces structural complexities and disturbances within the geological formations. Faults can significantly alter the orientations of bedding planes or induce structural variations, potentially contributing to the observed variations in dip azimuths within the structural zones. This proximity to a possible fault adds another layer of complexity to the structural characteristics observed in the area, influencing the diverse spread in dip azimuths recorded.
The interpretation of bedding dips derived from the Formation Micro-Imager (FMI) images unveils insights into both high-confidence and low-confidence classifications, revealing certain similarities and variations in their dominant structural characteristics. Both classifications consistently demonstrate a prevalent dip azimuth of S62W, along with a striking direction ranging approximately between N28W to S28E. This consistency in dip azimuths and strike directions across both classifications suggests a coherent structural orientation within the studied geological formation. However, notable variations emerge in the spread of dip magnitudes between these classifications. While the dominant dip azimuths and strikes remain consistent, differences arise in the magnitude of the observed dip angles. The high-confidence bedding dips typically exhibit more uniform and consistent dip magnitudes compared to the low-confidence ones, where a wider range of variability in dip angles is observed. These discrepancies in dip magnitude spread suggest differing levels of confidence or reliability in the measurement and interpretation of bedding dips between the high and low-confidence classifications. The variations in dip magnitudes within the low-confidence dips might stem from factors such as data quality, resolution, or interpretational uncertainties, leading to a broader range of observed dip angles compared to the more constrained and consistent measurements in the high-confidence classification. The comprehensive analysis of the continuous dip plot, amalgamating all bedding dips within the interval from 4374 m to 4640 m, unveils a predominant structural dip range falling within 30 to 40 degrees. This range emerges as the most prevalent structural inclination observed across the entirety of the logged interval. It signifies a consistent and frequent occurrence of dip angles within this specified range, indicating a prevailing structural orientation within the studied depth range.
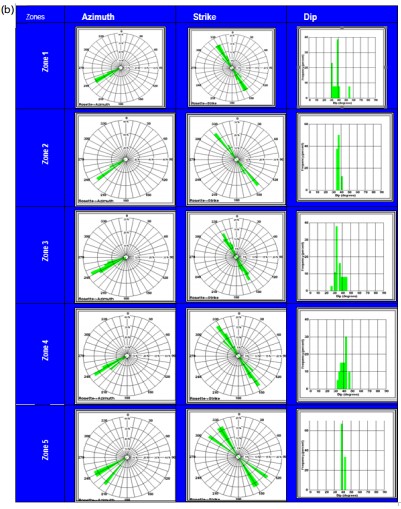
Nevertheless, amidst this overarching prevalence of dip angles between 30 to 40 degrees, significant local variations in dip magnitudes are noteworthy. These variations, as highlighted in Fig. 5(a-b) denote deviations or fluctuations from the predominant range of 30 to 40 degrees within localized sections of the logged interval. These localized variations in dip magnitudes suggest the presence of heterogeneities or localized structural complexities within the geological formation. Such deviations can be indicative of localized disturbances, changes in lithological properties, or structural variations influencing the observed dip angles within specific intervals, despite the prevalent structural trend.
Figure 5(a-b) likely displays statistical representations-plots or graphs-depicting the dips observed at the boundaries of beds across all zones within the Asmari Formation. It distinguishes between dips marked with low and high confidence levels, indicating the reliability and certainty associated with these measurements. These statistical plots provide a comprehensive overview of the variability and distribution of dip angles observed at bed boundaries throughout the various zones of the Asmari Formation. The differentiation between low and high-confidence dips allows for a nuanced understanding of the reliability of these measurements across different zones. By presenting this statistical information, Fig. 5(a-b) aids in visualizing and interpreting the dip characteristics within the Asmari Formation, offering insights into the overall structural trends, variations and representative dip angles, thereby assisting geologists and researchers in comprehending the structural complexities within this geological formation.
The observations drawn from the geological analysis underscore the predominant structural characteristics prevalent within the studied depth interval, emphasizing a remarkable consistency in dip azimuth and strike direction across the logged section. The prevalent dip magnitudes, predominantly falling within the 30-40-degree range, portray a prevalent and dominant structural orientation within the Asmari reservoir from 4374 to 4640 m. This consistent structural trend denotes a prevailing orientation of bedding planes or structural elements within the formation, signifying a coherent pattern in the structural framework.
Still, the noteworthy presence of localized variations in dip magnitude within specific zones indicates the existence of deviations or localized complexities in structural orientation within the same Asmari reservoir depth interval. These localized variations suggest that while there is a prevailing structural pattern across the interval, certain localized areas exhibit deviations or complexities in structural orientations. These variations could stem from localized geological features, alterations in lithological properties, or structural disturbances within specific sections of the formation. Despite the dominant structural trend, these localized complexities signify the presence of heterogeneities or localized variations within the structural framework of the Asmari reservoir in the specified depth range. A noteworthy feature highlighted in this cross-section is the presence of uneven bedding surfaces, distinctly portrayed in Fig. 6(a-b). These irregular bedding surfaces serve as potential indicators of diagenetic alterations within the Asmari reservoir. Such irregularities in the bedding surfaces signify possible modifications or alterations in the geological structure attributed to diagenetic processes. These alterations might encompass a diverse array of geological changes, including mineral transformations, dissolution, cementation, or other forms of alteration occurring over time. The presence of these irregularities offers crucial insights into the complex geological history of the Asmari Formation along this specific NNE-SSW orientation, shedding light on the multifaceted processes that have shaped the geological characteristics within the reservoir.
Table 2 functions as an extensive reservoir, consolidating pivotal dip attributes associated specifically with bedding or layer boundaries within the production zones of the Asmari Formation. This meticulously curated table offers a detailed quantitative perspective, furnishing a rich repository of insights into the inherent dip characteristics within these crucial zones. It serves as an invaluable resource, providing a comprehensive and measurable account of the prevailing structural features and orientations essential to the productive sectors of the Asmari reservoir. Contained within Table 2 is indispensable data pivotal in delineating the intricate structural intricacies and fluctuations that define the targeted production zones within the Asmari Formation. Encompassing a spectrum of dip attributes-including dip azimuths, dip angles and bedding characteristics-this tabulated information significantly contributes to an all-encompassing comprehension of the geological properties fundamentally influencing reservoir productivity.
The exhaustive nature of Table 2 furnishes an intricate quantitative outlook, fostering in-depth scrutiny of the structural orientations and complexities within these pivotal production zones. This data-centric methodology aids geologists and reservoir engineers in delineating and interpreting the intricate structural nuances, facilitating informed decisions about reservoir management and strategies for optimizing production within the Asmari Formation. Moreover, Table 2 serves as an invaluable reference for geologists, researchers and industry professionals involved in the study and analysis of the Asmari Formation. By meticulously detailing boundary properties, the table offers a deeper understanding of the geological composition, stratigraphy and structural intricacies intrinsic to the Asmari Formation. Its structured layout enables a comprehensive overview of diverse structural properties, facilitating the identification of patterns, correlations and variations across different zones or layers within the formation.
This table presents specific data and information regarding the structural characteristics associated with the boundaries of beds within the Asmari Formation zones.
The study leaned heavily on a meticulously curated dataset of dip angle measurements to create an intricate computer-generated cross-section precisely aligned along the NNE-SSW axis. This detailed representation provides a panoramic view, offering an in-depth understanding of the complex geological formations nestled within the Asmari reservoir.
This cross-section serves as a window into the structural intricacies woven into the geological landscape. By integrating the dip angle data, this visual representation unravels the interactions among various geological elements-stratification, fault lines and layering-significantly contributing to a nuanced comprehension of the geological framework within the Asmari reservoir.
Within this cross-section, meticulously constructed using Strucview and dip angle data, the geological features are organized and presented in sets delineating distinct structures. Notably, irregularities in bedding planes hint at potential diagenetic alterations, providing valuable insights.
Understanding these variations in anhydrite content is critical due to their potential impact on reservoir properties, fluid dynamics and drilling operations within the Asmari Formation. The primary goal of the study was to methodically analyze the structural attributes and comprehensively characterize fractures within the Asmari Formation. This involved a meticulous examination of datasets from the full set and the Formation Micro-Imager (FMI) logs. In this research carefully identified, documented and characterized fractures and faults, their findings were validated by NIOC South Operations, aligning with StrucView’s outcomes.
This alignment between Strucview and independent assessments signifies a significant achievement, with profound implications for optimizing reservoir development and production strategies. Figure 7(a-b) visually encapsulates these pivotal structural revelations and fracture characterizations, providing a foundation for well-informed decisions aimed at advancing reservoir operations within the Asmari Formation.
|
| Table 2: | Structural properties for bed boundaries in zones of Asmari Formation | |||
| Formation | Zones | Dominant dip azimuth | Dominant strike | Dominant dip inclination (deg.) | Figures |
| Asmari | Zone1 | S60W | N30W-S30E | 39 (Rang 30-56) | Fig. 5 |
| Zone 2 | S52W | N38W-S38E | 56 (Range 34-42) | Fig. 5 | |
| Zone 3 | S62W | N28W-S28E | 48 (Range 26-46) | Fig. 5 | |
| Zone 4 | S58W | N32W-S32E | 43 (Range 32-48) | Fig. 5 | |
| Zone 5 | S50W | N40W-S40E | 39 (Range 38-44) | Fig. 5 | |
| Structural dip | S62W | N28W-S28E | 33 (Range 26-56) | Fig. 5 |
Understanding natural fractures
Characterization and analysis: Fractures, as identified in this study, are essentially planar features characterized by a lack of significant movement between blocks along their planes. These fractures can manifest with varying degrees of aperture, showcasing a spectrum from open (exhibiting more space between fractured surfaces) to tight or closed (with minimal separation between surfaces). Additionally, these fractures might also be filled with minerals like clays, calcite, anhydrite, pyrite, among others, further altering their characteristics and properties9.
The primary focus of the study was on the analysis of these fractures using data obtained from the Formation Micro-Imager (FMI) survey. This high-resolution survey was instrumental in capturing detailed images of these fractures within the geological formation under investigation. To comprehensively understand the fractures, the interpretation of these FMI images was conducted in conjunction with the examination of open-hole logs. This combined analysis aimed to provide a more thorough understanding of the fractures’ various attributes, such as their orientation, distribution, aperture and potential mineral fillings. These details were instrumental in delineating the diverse nature and characteristics of fractures within the studied geological context.
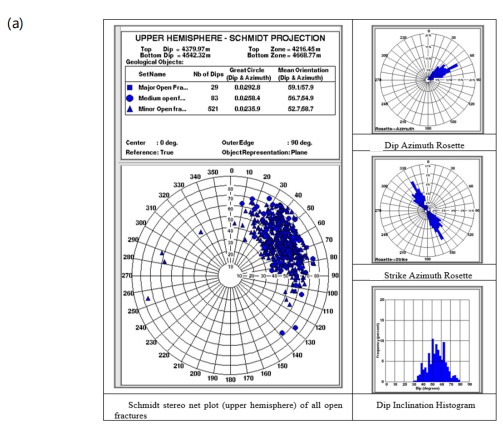
The high-resolution FMI images provided detailed insights into the intricate fracture network present within distinct zones of the Asmari Formation. The comprehensive analysis of these images unveiled a total of 897 fractures within the studied interval, categorized into three main types: 633 open fractures, 39 closed fractures and 87 potentially open fractures. Visual representations in Fig. 8-14 offer a detailed visualization of these identified fractures, aiding in understanding their distribution and characteristics within the geological formation.
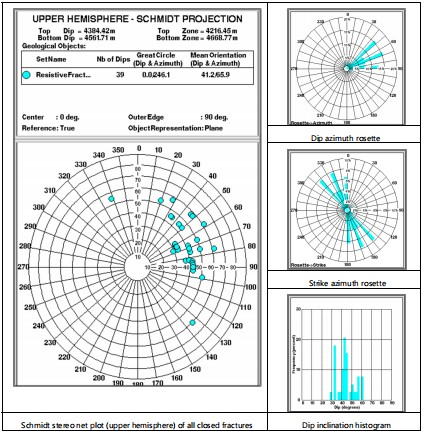
Among these identified fractures, a subset of 39 fractures exhibited distinct resistive or tight traces, as illustrated in Fig. 11. These particular traces, characterized by their resistive nature, led to the classification of these fractures as closed. The clear depiction of these distinctive traces in the images helped differentiate them from the open fractures, contributing to the detailed categorization and understanding of the diverse fracture types present within the Asmari Formation.
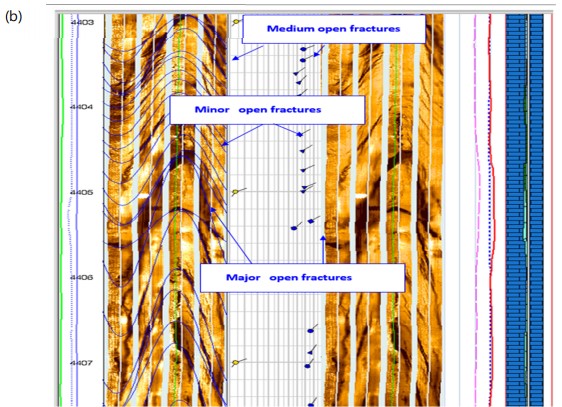
Within the studied interval, fractures exhibiting conductive traces-either continuously or discontinuously-are classified as open fractures. A comprehensive analysis has identified a total of 633 such fractures across the entire interval, often concentrated in specific localized areas. These fractures showcase diverse characteristics, encompassing variations in aperture appearance and the continuity of their traces along the length of the wellbore. The visual representation in Fig. 9 and Fig. 10 provides an overview of these fractures, highlighting their distribution and characteristics within the geological formation.
To streamline the categorization and assessment of these fractures, they’ve been classified into three distinct categories based on their attributes. Firstly, major open fractures, numbering 29 in total, are characterized by prominent and sizable apertures, accompanied by continuous traces observed consistently along the wellbore. These fractures stand out for their notable size and continuous presence, indicating their significance in facilitating fluid flow within the geological formation.
|
|
|
Secondly, medium-open fractures, totaling 83 in count, exhibit traces that are continuous, albeit with smaller apertures compared to the major-open fractures. Despite their slightly reduced aperture size, these fractures maintain a level of continuity along the wellbore, contributing to the permeability of the formation.
Lastly, the most abundant category consists of 521 fractures classified as minor-open fractures. These fractures demonstrate traces with varying levels of discontinuity, exhibiting less defined and intermittent characteristics along the wellbore. Despite their abundance, their less continuous and defined nature sets them apart from the major and medium-open fractures in terms of their contribution to fluid movement within the formation. This categorization allows for a detailed understanding of the diverse attributes and implications of these open fractures on fluid flow and permeability within the geological formation.
Among the categorized fractures, major open fractures stand out with a count of 29, showcasing substantial apertures and maintaining continuous traces throughout the entirety of the wellbore. Their notable presence and pronounced characteristics make them easily identifiable and distinguishable within the geological formation under study. These major open fractures, marked by their larger apertures, provide significant pathways for fluid flow and play a pivotal role in permeability enhancement.
|
|
Following closely behind are 83 medium-open fractures, which, while not exhibiting the same extensive aperture as the major fractures, still demonstrate continuous traces along the wellbore. This consistent tracing denotes a significant level of connectivity, albeit with slightly smaller apertures compared to the major-open fractures. Their presence contributes to facilitating fluid movement within the formation.
The most abundant category comprises 521 fractures categorized as minor-open fractures. These fractures, while numerous, exhibit less pronounced traces and demonstrate discontinuity along the wellbore. Their characteristics, as detailed in Fig. 9 and Fig. 10, illustrate a less defined nature, with intermittent or fragmented traces visible along the wellbore’s path. Despite their abundance, the minor-open fractures lack the continuous and well-defined features observed in the major and medium-open fractures. This difference in trace continuity and definition among the for.
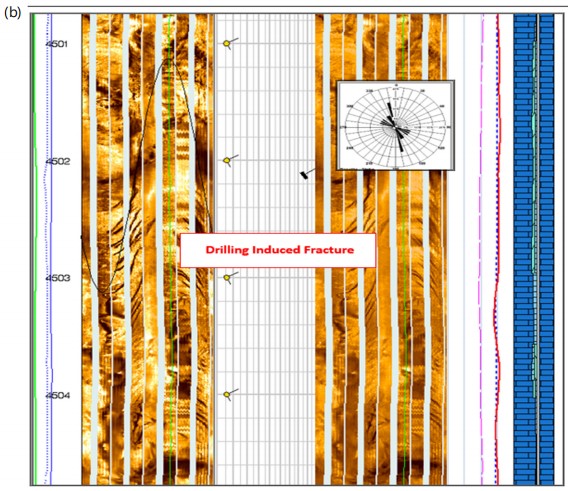
In specific sections of the studied well within the Asmari Formation, induced fractures have been identified, originating from the drilling operations conducted in this area. These induced fractures hold significant importance as they serve as crucial indicators aiding in determining the orientation of stress within the geological formation. The comprehensive analysis of these induced fractures and their implications for understanding the stress regime is extensively discussed in the in-situ stress analysis section of this report. This detailed discussion, accompanied by visual representations in Fig. 15 and 16, provides a comprehensive overview of the implications and relevance of these induced fractures in the broader context of stress orientation analysis within the studied geological formation.

|
|
| Table 3: | Dip attributes associated with all fractures within the Asmari Formation | |||
| Formation | Zones | Dominant dip azimuth |
Dominant strike | Dominant dip inclination (deg.) |
Figures | Type of fractures |
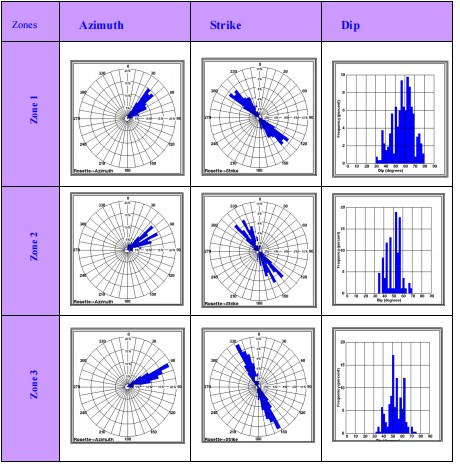
| Asmari | Zone1 | N38E | N52W-S52E | 63 (Rang 30-80) | Fig. 14 | Longitudinal and oblique |
| Zone 2 | N52E | N38W-S38E | 53 (Range 36-70) | Fig. 14 | Longitudinal and oblique | |
| Zone3 | N62E | N28W-S28E | 51 (Range 32-74) | Fig. 14 | Longitudinal and oblique | |
| Structural dip | N62E | N28W-S28E | 52 (Range 30-80) | Fig. 14 | Longitudinal and oblique |
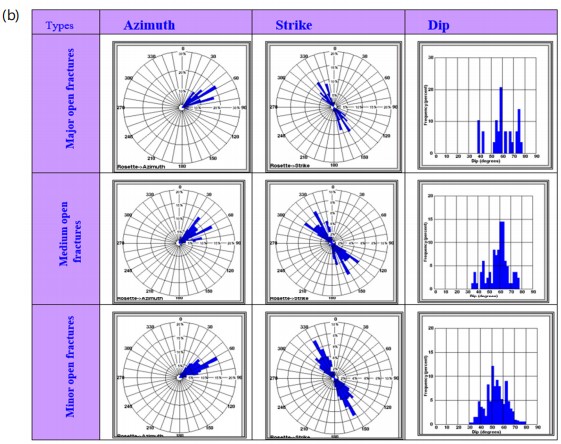
Fracture dip and strike analysis: In contrast, major-open fractures demonstrate a prevailing northeast dip, varying between 50 to 60 degrees, coupled with a primary strike direction spanning from N32W to S32E. This inclination and strike pattern of major-open fractures is notably distinct and discernible, as highlighted in the visual representations across Fig. 8(a-b) and Fig. 9(a-b) providing clear insights into their orientation within this geological formation.
Conversely, minor open fractures exhibit a distinct 52-degree dip directed to N62E, with a striking range from N28W to S28E. The characteristics of these minor open fractures are specifically detailed in Fig. 9, offering a focused representation of their orientation within the studied interval.
The closed fractures within this context reveal a prevalent dip angle of 44 degrees directed to the N60E, while their strike spans from N30W to S30E. These closed fractures appear to be predominantly clustered in the middle and lower sections of the interval under study. This distinct orientation and clustering are vividly showcased in Fig. 11 and 12 offering a comprehensive visual representation of their distribution and directional characteristics within the specified depth range.
Table 3 likely includes data on dip angles, dip directions, fracture lengths, orientations, densities and other relevant attributes associated with each identified fracture within the Asmari Formation. By compiling this information in a structured format, Table 3 offers a systematic presentation of the fracture attributes, allowing geologists, researchers, or professionals studying the Asmari Formation to analyze and understand the nature, distribution and properties of fractures within this geological context. This detailed documentation serves as a valuable resource, facilitating comprehensive analysis and interpretation of fracture patterns and orientations, aiding in various geological studies, reservoir characterization and exploration strategies within the Asmari Formation (Fig. 13 and 14).
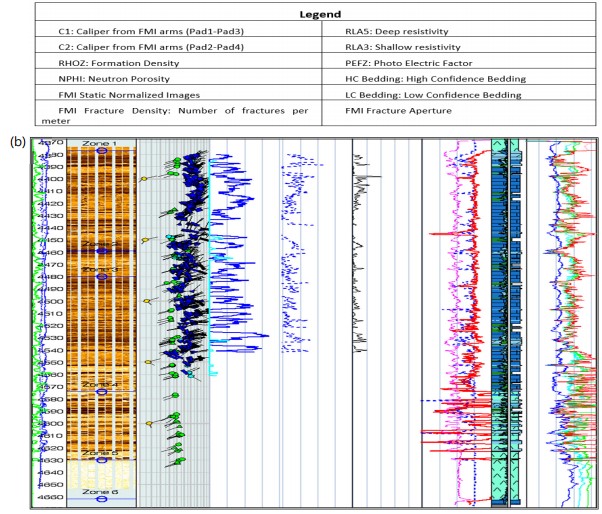
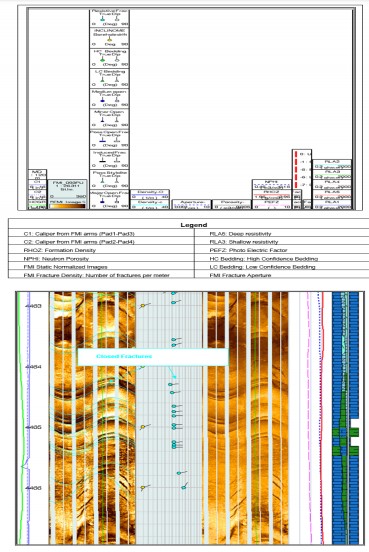
Fracture density and occurrence: Fractures are extensively distributed throughout the Asmari Formation, with a significant concentration particularly noticeable within limestones and dolomitic limestone layers, as indicated in Fig. 4. These specific lithological formations appear to host a notable abundance of fractures, highlighting their prevalence and potential significance in this geological context.
Open fractures, in particular, are prominently present within three main zones: The intervals of 4377-4459, 4459-4480 and 4480-4574 m. This distribution of open fractures is visually depicted across multiple figures, including Fig. 4 providing a comprehensive visualization of their occurrence and concentration within these delineated depth intervals.
Porosity due to fractures: This calculation serves as the relationship between the fracture area (determined by multiplying fracture length with fracture aperture) and the area of the borehole scanned by the FMI images.
|
|
|
The table provided below categorizes different zones based on distinct ranges of fracture porosity. To ensure clarity and ease of understanding, fracture porosity is presented as a percentage rather than a fraction, allowing for a clearer representation of the data and its significance within each categorized zone. This categorization based on varying levels of fracture porosity aids in identifying and understanding the distribution and significance of fractures within the scanned borehole area.
Fracture aperture analysis: The range of fracture apertures across this area showcases a diverse spectrum, spanning from 0.001 cm (0.01 mm) in multiple locations to 0.2 cm (2 mm) specifically around the depth of 4389 m. Interestingly, a significant portion of these fractures tends to hover around the 0.001 cm (0.01 mm) mark. However, Zone 1 notably stands out, displaying the highest average fracture aperture observed within this region. This standout characteristic is visually depicted in Fig. 4 and further detailed in Table 4, emphasizing the distinctiveness of Zone 1 in terms of fracture aperture compared to the surrounding areas.
| Table 4: | Overview of fracture zone characterization primarily focused on interval mean porosity | |||
| Zones | Zone width (m) |
Number of open fractures |
Mean fracture density (1/m) |
Mean fracture aperture (cm) |
Mean fracture porosity (m3/m3) |
Reference |
| Zone 1 | 82 | 267 | 9.42 | 0.0073 | 0.00031 | Fig. 4 |
| Zone 2 | 21 | 85 | 8.15 | 0.0025 | 0.00013 | Fig. 4 |
| Zone 3 | 94 | 281 | 10.56 | 0.0043 | 0.0002 | Fig. 4 |
The mean fracture porosity values in different zones are notably affected by segments within those zones where no fractures are present, consequently registering a porosity of zero. Specifically, in zones 1, 2 and 3, there’s a noticeable prevalence of major and minor open fractures, exerting a substantial influence on not just the fracture porosity but also on the NPHI and RHOZ curves.
These zones with higher counts of fractures significantly impact the neutron porosity (NPHI) and bulk density (RHOZ) curves. The presence and density of these fractures play a pivotal role in altering the recorded measurements. This alteration occurs due to the direct impact these fractures have on the underlying rock properties within these zones, affecting how porosity is measured and consequently impacting the curves reflecting porosity and density measurements.
Predictive flow profile analysis: Leveraging fracture aperture data offers a valuable opportunity to predict how a reservoir will produce over time. This forecast relies on understanding how fractures enhance the reservoir’s permeability. The assumption here is that the production of the reservoir is heavily influenced by these fractures.
Based on this assumption, we’ve pinpointed zones 1, 2 and 3 in Fig. 4 as areas likely to exhibit higher productivity. These zones are expected to show increased production rates due to the way fractures enhance the permeability of the reservoir. The fractures essentially act as pathways, allowing fluids to flow more freely through these specific zones, potentially leading to elevated production levels compared to other areas within the reservoir. This anticipation of higher productivity in these identified zones is based on the understanding that fractures play a crucial role in governing the flow and production behavior of the reservoir.
Fracture types and their impact on productivity: In fields housing both gas-cap and water-pool reservoirs, comprehending the spatial distribution of distinct open fractures concerning the Gas-Oil-Contact (GOC) and Oil-Water-Contact (OWC) is pivotal. The prevalent NW-SE striking open fractures, aligning almost parallel to the NW-SE bedding strike (Fig. 13), are likely longitudinal fractures following the structural dip. Typically, these fractures tend to exhibit a limited vertical extent within a single layer or bed, yet their horizontal span can be more pronounced than their vertical length. Conversely, transverse fractures often display longer vertical and horizontal extents.
From a reservoir perspective, transverse fractures, such as those in the NE-SW direction, exhibit notably high permeability and extension. These fractures, if intersecting the GOC or WOC, possess the capacity to readily connect wells with the gas-cap or water pool. Among various influencing factors, the stress orientation concerning the fracture’s strike significantly governs their vertical and horizontal extents, as well as their permeability. In the studied well, the dominant set of NW-SE striking open fractures coincides with the minimum horizontal stress of the Zagros stress system (Fig. 13(a-b) and Fig. 14). In such instances, these fractures tend to exhibit lower permeability and productivity but greater vertical and horizontal extents.
Therefore, these fractures could play a decisive role in governing the production dynamics of reservoir fluids, including gas, oil, water, or their mixtures.
In-situ stress analysis
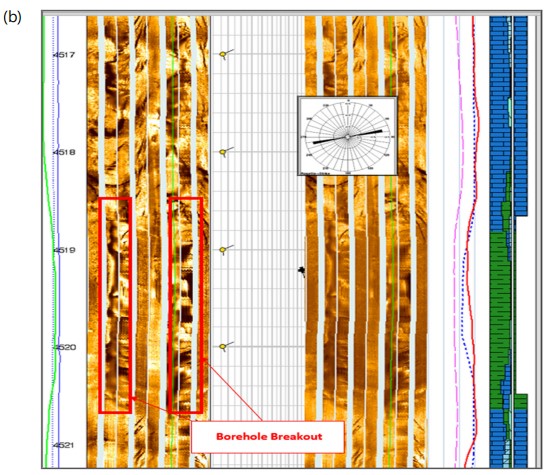
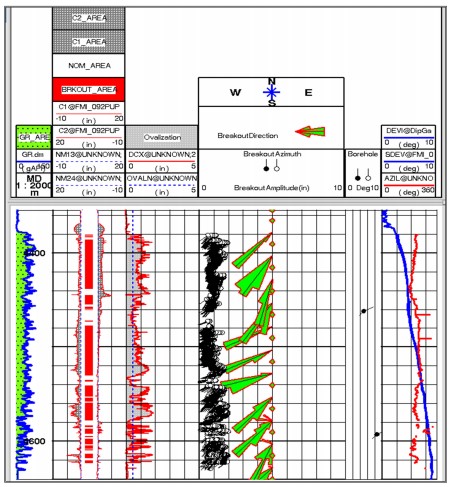
Borehole breakout analysis: At a depth of 4519 m in the well, a notable borehole breakout highlighted in Fig. 15(a-b) unveils crucial insights into stress orientation within this geological formation. This breakout pattern reveals the prevailing direction of minimum horizontal stress (σhmin) in the NE-SW direction, indicating the path of least resistance for rock deformation. This deduction leads to inferring the maximum horizontal stress (σHmax) as perpendicular to σhmin, aligning along the NW-SE direction, a significant observation illustrated in Fig. 15 and Fig. 16(a-b).
Understanding these stress orientations holds paramount importance. It aids in comprehending the mechanics of the rock formation at this depth, influencing wellbore stability, hydraulic fracturing operations and predicting overall reservoir behavior10.
This specific insight at 4519 m offers critical information for wellbore design and drilling operations. It empowers engineers and geoscientists to make informed decisions regarding directional drilling strategies, casing designs and hydraulic fracturing plans, optimizing well performance and addressing potential borehole stability issues in this specific geological context.
Within zones 1, 2 and 3 of the Asmari reservoir, specific drilling-induced fractures have been meticulously observed at various depths: 4441, 4452, 4474, 4508 and 4547 m (Fig. 16). These fractures consistently align along an N18W-S18E direction.
This alignment provides compelling evidence and inference about the stress regime near the ZE-015 well. It indicates that the maximum horizontal stress (σHmax) around the ZE-015 well aligns NW-SE, correlating closely with the σHmax direction inferred from borehole breakout analysis.
Furthermore, this alignment reaffirms the orientation of the minimum horizontal stress (σhmin) as NE-SW, as previously deduced from borehole breakout observations at 4519 m (Fig. 15 and 16). The consistency in fracture orientation across depths reinforces the understanding of stress orientations in this geological formation.
This thorough analysis not only reaffirms stress orientations but also offers spatial insight into stress pattern propagation within the Asmari reservoir. These detailed insights guide reservoir engineers, geologists and drilling professionals in making precise decisions about wellbore stability, hydraulic fracturing strategies and overall reservoir management practices.
The intriguing observation around the study well lies in its deviation from the expected regional stress orientation in the Zagros fold-belt. Typically, the Zagros fold-belt displays a distinct stress orientation based on broader geological characteristics and regional tectonic forces. The discrepancy between observed stress orientations and expected regional patterns raises significant geological considerations. It suggests that localized geological features or structural complexities may influence the stress regime captured by borehole breakout and drilling-induced fractures.
This divergence could stem from factors such as local faulting, geological heterogeneities, or the interplay of stress regimes within microstructural elements. Understanding this divergence is crucial for accurate reservoir characterization, wellbore stability assessments and successful drilling operations within this unique geological setting. This anomaly challenges conventional assumptions, emphasizing the necessity for a nuanced understanding of complex geological structures and stress distributions within the Zagros fold belt. In-depth studies focusing on localized stress variations refine geological models and enhance predictions related to reservoir behavior and well performance in similar geological settings.
Calibration results: The assessment of borehole enlargement using dual caliper measurements plays a pivotal role in drilling operations. This process involves comparing actual caliper measurements with initially set ‘nominal’ values aligned with the expected bit-size diameter. Any discrepancy between these figures indicates changes in borehole diameter. Initially, nominal values match the anticipated diameter, but encountering diverse geological conditions, such as washouts, can cause unexpected borehole enlargement. Adjusting these nominal values in subsequent passes is crucial to accommodate such changes, ensuring accurate assessments that aid in wellbore stability and casing design.
However, adjusting nominal values presents challenges, especially when breakout and washout occur at right angles. Breakout involves borehole wall expansion due to compressive stress, while washout results from fluid circulation. When these occur perpendicular to each other, accurately distinguishing their effects requires expert analysis to attribute changes in caliper readings correctly.
This complexity underscores the necessity for meticulous interpretation by experienced personnel. Precise assessments mitigate potential wellbore stability issues, ensuring wellbore integrity, particularly in challenging geological conditions, thereby optimizing drilling operations.
The concept of ‘differential enlargement’ is pivotal in evaluating borehole ovality by measuring discrepancies in enlargements in different directions. This measurement crucially indicates the extent of ovality or deformation. An ‘Ovalization’ flag activates when the differential enlargement exceeds a specified threshold, signaling significant deviations from the expected circular borehole shape.
In observations within the Asmari Formation, NE-SW trending borehole breakouts were noted, suggesting the alignment of the direction of minimum horizontal stress (σhmin) with this trend. This implies that σHmax aligns with the NW-SE direction. Understanding these stress orientations is critical for predicting wellbore stability and guiding drilling strategies, casing programs and hydraulic fracturing plans within this geological context.
The ‘Ovalization’ flag enhances precision by identifying substantial deviations from the expected borehole shape triggered by differential enlargement surpassing the set threshold (Fig. 17). These stress orientation observations offer crucial insights into the mechanical behavior of the Asmari Formation. They illuminate the prevailing stress conditions, essential for comprehending rock mechanics, stability assessments and guiding drilling and production strategies within the Asmari reservoir.
Result correlation with recent publications: The structural analysis conducted in this study aligns with several recent publications, highlighting both similarities and variations in findings across different geological contexts.
Consistent dip azimuth and strike direction: The study consistently identifies a prevalent dip azimuth of S62W and a strike direction ranging between N28W to S28E, which is in line with previous literature that also found coherent structural orientations within their studied formations.
Variations in dip magnitudes: The study notes variations in dip magnitudes within the studied interval, which is a common observation in geological formations due to factors such as diagenetic processes and proximity to fault zones. These findings are consistent with research that emphasizes the influence of such factors on dip angle variations.
Complex structural framework: The presence of local variations in dip magnitudes and deviations from the predominant structural trends is indicative of a complex structural framework, aligning with literature highlighting the challenges in identifying clear and consistent major structural trends within geological formations.
Dip angle spread and confidence levels: The study distinguishes between high-confidence and low-confidence classifications of bedding dips, noting differences in dip magnitude spread between these classifications. This observation resonates with research that discusses varying levels of confidence or reliability in dip angle measurements based on data quality and interpretational uncertainties.
Localized variations and irregularities: The study identifies localized variations in dip magnitudes and irregularities in bedding surfaces, emphasizing the presence of heterogeneities and localized complexities within the geological formation. This finding is in line with literature discussing the impact of localized geological features, diagenetic alterations and structural disturbances on structural orientations and complexities.
Fracture characteristics: The analysis of fracture dip, strike, density and occurrence aligns with previous studies that emphasize the distribution, orientation and impact of fractures on reservoir properties, fluid dynamics and production strategies within geological formations.
Stress analysis and deviations from regional patterns: The stress analysis findings, including borehole breakout observations and drilling-induced fractures, highlight deviations from expected regional stress orientations. This observation resonates with research that emphasizes the influence of localized geological features, faulting and structural complexities on stress regimes within specific geological settings.
Overall, the correlation of these findings with recent publications underscores the complexity and variability inherent in geological formations, emphasizing the importance of comprehensive structural and fracture analyses for informed decision-making in reservoir management and exploration strategies.
CONCLUSION
The Asmari Formation showcases a predominant structural dip of 33 degrees directed towards S62W. Within this formation, a detailed examination has revealed numerous instances of fracturing. Among the identified 633 total open fractures, a categorization highlights 29 as major features, distinguished by their prominent characteristics. Contrarily, 521 fractures fall into the category of minor open fractures, marked by smaller aperture sizes and intermittent traces spread across the interval. These major open fractures notably exhibit discontinuous features, leaving distinct and discernible traces visible on the FMI tool pads-a significant aspect aiding in their identification and characterization.
The primary azimuth trend governing these open fractures points toward N62E, showcasing a range of dip inclinations spanning from 50 to 70 degrees. Noteworthy is the striking correlation between the direction of these fractures and the dominant structural bedding, suggesting their alignment parallel to the structural axis-a critical insight into their spatial orientation within the geological context. Additionally, scrutiny of the bedding surface uncovers several diagenetic features associated with dolomitization, prominently exposed due to drilling operations conducted in near parallel alignment with the bedding orientation.
Further assessment within the logged interval reveals the identification of five drilling-induced fractures primarily located in the upper sections. This presence signifies the probable orientation of maximum horizontal stress proximate to the borehole, notably oriented NW-SE-an essential consideration influencing wellbore stability and drilling strategies. Additionally, the delineation and hierarchical ranking of three distinct fractured zones are based on the estimated mean porosity within each zone, providing crucial insights into their permeability variations and reservoir characteristics.
Vertical interference tests (VIT) conducted through modular formation dynamics testing (MDT) hold significant importance, especially in areas showcasing dense or low porosity streaks. These tests serve the crucial purpose of determining whether these streaks function as hindrances or barriers to vertical reservoir flow. Additionally, they play a pivotal role in assessing the presence and extent of open fractures within these formations. Heterogeneity analysis, meanwhile, provides valuable proportional values for distinct geological features. These insights serve as crucial data inputs, facilitating the development of neural network programs designed to identify various rock or litho-types in future studies. Moreover, for accurate calibration and normalization of the final permeability indicator derived from Formation Micro-Imager (FMI) data, reliance on Sw (water saturation) and dynamic permeability insights obtained from MDT or core permeability data is recommended.
SIGNIFICANCE STATEMENT
This study introduces an innovative workflow designed for fractured carbonate reservoirs, with potential for broad application to similar geological formations. Spearheaded by the National Iranian South Oil Company, this method is especially valuable where traditional coring data is unavailable. By integrating image logs, the approach enhances coring accuracy and efficiency, reducing drilling costs significantly. This method not only improves the precision of drilling strategies but also supports the drilling of more wells, optimizing field development. It promises a cost-effective, scalable solution for evaluating fractured carbonate reservoirs, streamlining exploration and production across varied geological landscapes.
REFERENCES
- Alavi, M., 2004. Regional stratigraphy of the Zagros fold-thrust belt of Iran and its proforeland evolution. Am. J. Sci., 304: 1-20.
- Alizadeh, M., Z. Movahed and R.B. Junin, 2015. Reservoir heterogeneity analysis using formation micro imager log and the other geological logs. Environ. Sci.: Indian J., 11: 51-56.
- Nelson, R.A., 2001. Geologic Analysis of Naturally Fractured Reservoirs. 2nd Edn., Gulf Professional Publishing, London, United Kingdom, ISBN: 978-0-88415-317-7, Pages: 332.
- Khoshbakht, F., H. Memarian and M. Mohammadnia, 2009. Comparison of Asmari, Pabdeh and Gurpi formation's fractures, derived from image log. J. Pet. Sci. Eng., 67: 65-74.
- Shariatinia, Z., M. Haghighi, S. Feiznia, D. Hall, G. Levresse, A.M. Dehghani and M. Rashidi, 2013. Paleofluid analysis from fracture-fill cements in the Asmari limestones of the Kuh-I-Mond field, SW Zagros, Iran. Arabian J. Geosci., 6: 2539-2556.
- Movahed, Z. and F. Aghajari, 2022. Analytical fractured reservoir characterization by using geological and petrophysical logs. Curr. Res. Geosci., 12: 11-28.
- Delleur, J.W., 2006. The Handbook of Groundwater Engineering. 2nd Edn., Crc Press, United States, ISBN-13: 978-0-8493-4316-2, Pages: 1320.
- Movahed, Z., M. Ashraf and A.A. Movahed, 2023. Assessment of fracture density distribution from image logs for sensitivity analysis in the Asmari fractured reservoir. Earth Sci. Hum. Constr., 3: 99-118.
- Movahed, Z., F. Aghajari and A.A. Movahed, 2023. Characterization of reservoir by using geological, reservoir and core data. J. Appl. Sci., 23: 34-46.
- Movahed, Z., R. Junin and P. Jeffreys, 2014. Evaluate the borehole condition to reduce drilling risk and avoid potential well bore damages by using image logs. J. Pet. Sci. Eng., 122: 318-330.
How to Cite this paper?
APA-7 Style
Movahed,
Z. (2024). Evaluating the Asmari Fractured Reservoir: Findings from FMI and Petrophysical Logging. Asian Science Bulletin, 2(4), 480-508. https://doi.org/10.3923/asb.2024.480.508
ACS Style
Movahed,
Z. Evaluating the Asmari Fractured Reservoir: Findings from FMI and Petrophysical Logging. Asian Sci. Bul 2024, 2, 480-508. https://doi.org/10.3923/asb.2024.480.508
AMA Style
Movahed
Z. Evaluating the Asmari Fractured Reservoir: Findings from FMI and Petrophysical Logging. Asian Science Bulletin. 2024; 2(4): 480-508. https://doi.org/10.3923/asb.2024.480.508
Chicago/Turabian Style
Movahed, Zohreh.
2024. "Evaluating the Asmari Fractured Reservoir: Findings from FMI and Petrophysical Logging" Asian Science Bulletin 2, no. 4: 480-508. https://doi.org/10.3923/asb.2024.480.508

This work is licensed under a Creative Commons Attribution 4.0 International License.