
Physico-Chemical and Pasting Characteristics of Cassava, Wheat Flours and Their Composite Blends
-
Frederick Ideyienmhi Omenai
Department of Chemistry, University of Benin, Benin, Nigeria
Chinyere Imoisi

Department of Industrial Chemistry, Mewar International University, Nasarawa, Nigeria
Julius Uche IyaseleDepartment of Chemistry, University of Benin, Benin, Nigeria
| Received 23 Feb, 2024 |
Accepted 17 Apr, 2024 |
Published 31 Dec, 2024 |
Background and Objective: Given the high abundance of cassava flour in the country and the imperative to bolster cassava farmers’ income, there’s a proposal to amplify the proportion of cassava flour in bread and other product formulations. This initiative aims to catalyze job creation along the production value chain, thereby augmenting the nation’s GDP and bolstering its foreign exchange earnings. This study seeks to scrutinize the physico-chemical attributes of cassava and wheat flour and fabricate composite flour blends of cassava/wheat at varying substitution levels from 0 to 100%. Materials and Methods: Composite flours were prepared by blending cassava flour and wheat flour in the ratios of 100:0 (CS/WT), 90:10 (CS/WT), 80:20 (CS/WT), 70:30 (CS/WT), 50:50 (CS/WT), 30:70 (CS/WT) and 0:100 (CS/WT), respectively. The blends were analyzed for pasting properties using standard methods. These blends were evaluated for their pasting properties to gauge their suitability for diverse food applications. Furthermore, proximate analysis was conducted on quality cassava flour, alongside whole wheat flour, yielding varying compositions in terms of moisture, crude protein, ash content, fat, crude fiber and carbohydrate. Results: The dough mixing stability exhibited an upward trajectory with increasing wheat flour content, potentially attributable to gluten content. The results delineate a range of pasting temperatures from 73.35 to 89.7°C, with other pasting parameters exhibiting a declining trend as wheat flour content increased, except for setback and peak time which exhibited an upward trend. Overall, the findings shed positive light on the characteristics of cassava-wheat blends, offering avenues for harnessing cassava’s potential and augmenting value-addition prospects for product diversification. Conclusion: The pasting properties assessment revealed distinct parameters for cassava and wheat flours, emphasizing their unique attributes and potential applications in food formulation.
INTRODUCTION
The significant expenditure incurred by the Federal Government of Nigeria on wheat flour imports, especially for bakery product manufacture like bread, prompted a strategic move towards economic diversification1. Consequently, the government proposed a blend comprising 10% cassava flour and 90% wheat flour for bread production. This initiative yielded positive outcomes, enhancing product quality and gaining consumer acceptance2.
Nigeria boasts the status of the world's largest cassava producer, with an annual output exceeding 34 million tons of tuberous roots2. Cassava cultivation plays a pivotal role in the rural economy of the southern agro-ecological zone, ensuring year-round availability for household food security. However, due to its high moisture content (60-65%), transportation of the bulky roots from rural areas poses logistical challenges and costs3. To mitigate this, cassava is commonly traded in processed forms, reducing moisture content and enhancing transportability.
Over the years, cassava has undergone transformation into various products for both domestic and industrial utilization4. However, its raw form contains cyanide, necessitating processing to reduce cyanide levels to safe limits. Despite this, cassava remains integral to the diets of millions, especially in tropical and subtropical regions, owing to its resilience, nutritional value and energy-dense nature5. Wheat, a staple crop cultivated worldwide for millennia, is classified into hard and soft varieties based on protein content6. Its historical significance as a nutritional food source persists, with its seeds comprising three edible parts: Bran, germ and endosperm, rich in fiber, protein, minerals, vitamins and gluten7. Wheat's versatility and nutritional profile have contributed to its continued use in various food and product applications.
In summary, the juxtaposition of cassava and wheat underscores their complementary roles in food security, economic diversification and nutritional sustenance, shaping agricultural landscapes and consumption patterns globally8. Efforts to harness the potential of these crops through strategic initiatives and technological advancements hold promise for enhancing food security and economic prosperity in Nigeria and beyond. This study seeks to scrutinize the physico-chemical attributes of cassava and wheat flour and fabricate composite flour blends of cassava/wheat at varying substitution levels from 0 to 100%. These blends were evaluated for their pasting properties to gauge their suitability for diverse food applications.
MATERIALS AND METHODS
Study area and sites: Benin City is a prominent urban center situated in Edo State, Nigeria. Positioned at approximately 6.34°N Latitude and 5.63°E Longitude, it rests at an elevation of 88 meters above sea level. With a population estimated at 1,125,058 inhabitants, Benin City stands as the most densely populated city within Edo State9.
Sample collection and analysis: Mature cassava root tubers weighing 20 kg, aged over twelve months, were harvested from a farm affiliated with the Department of Agricultural Science Education, College of Education, Ekiadolor-Benin, Edo State, Nigeria. This study was carried out from February, 2015 to July, 2016 and the harvested tubers underwent a series of steps for processing. Firstly, they were thoroughly washed to remove any sand or soil residues and then peeled using stainless knives. After another round of washing to eliminate dirt, the tubers were sliced into smaller pieces and spread out on a clean flat surface for air and sun drying. This drying process facilitated fermentation and reduced the moisture content. Once adequately dried, the cassava chips were milled through a dry milling process to produce cassava flour. The resulting flour underwent sieving with a mesh to reduce fiber content before being carefully packaged in air-tight containers in powdered form for use as samples in the research. The color of the cassava flour was noted as white. Additionally, wheat kernels were procured from Uselu market, Benin-City, Edo State, Nigeria. Prior to grinding into powdered form, the kernels were subjected to physical examination, sorting, cleaning and drying. The resulting product, known as whole wheat flour weighing 7 kg, was also packaged in air-tight containers and used as wheat flour samples in the research. The color of the wheat flour was described as off-white.
| Table 1: | Incorporation of cassava flour with wheat | |||
| Sample code (%) | Classification |
| CS/WT (100/0) | Control (100 g cassava flour) |
| CS/WT (90/10) | 90% cassava flour+10% wheat flour |
| CS/WT (80/20) | 80% cassava flour+20% wheat flour |
| CS/WT (70/30) | 70% cassava flour+30% wheat flour |
| CS/WT (50/50) | 50% cassava flour+50% wheat flour |
| CS/WT (30/70) | 30% cassava flour+70% wheat flour |
| CS/WT (0/100) | 100% wheat flour |
Preparation of composite cassava flour and incorporation with wheat: Composite cassava flour was produced using the straight dough process described by Imoisi et al.10. Cassava and wheat flour weighing were carried out on a laboratory scale. Dough was mixed to optimum consistency in a mixer with low speed 85 rpm for 1 min. The substitution of cassava flour by wheat flour was 0, 10, 20, 30, 50, 70 and 100% for CS/WT(100/0%), CS/WT(90/10%), CS/WT(80/20%), CS/WT(70/30%), CS/WT(50/50%), CS/WT(30/70%) and CS/WT(0/100%), respectively in Table 1.
Proximate analysis of the composite cassava flour: The proximate composition analysis followed the procedures outlined by Imoisi et al.11. The functionality of cassava flours, largely influenced by their starch and protein content, plays a crucial role in the formulation and characteristics of the end product. Hence, the flours underwent analysis to determine their functional properties, which are essential for formulating value-added composite bakery goods. Additionally, protein content was determined using the micro-Kjeldahl method (N×6.25), while fat content was assessed via solvent extraction. Carbohydrate content was calculated using the subtraction method.
Determination of moisture content: The moisture content was assessed using the oven-drying method. Initially, clean and dry Petri dishes were weighed on a meter balance and their respective weights were recorded (W1). Approximately 5 g of the sample were then carefully weighed into the Petri dishes (W2), ensuring an even spread. These dishes, containing the sample, were placed into an oven maintained at 105°C and left to dry for approximately 3 hrs.
After the drying period, the Petri dishes were removed from the oven and allowed to cool in a desiccator before being weighed again. This process was repeated until a consistent weight (W3) was achieved. The loss in weight during drying, expressed as a percentage, represented the moisture content of the sample.
The percentage moisture content was calculated using the following equation as described by Imoisi and Michael9:
Where:
| W1 | = | Initial weight of the empty Petri dish | |
| W2 | = | Weight of the empty Petri dish plus sample before drying | |
| W3 | = | Final weight of the empty Petri dish plus sample after drying |
Ash determination: Approximately 1 g of finely ground sample was carefully weighed into clean, dried crucibles with lids (W1). The organic matter present in the sample was then burnt off using a flame, with the lid removed, until the sample was charred. Subsequently, the crucibles were transferred to a muffle furnace set at 550°C (with the lid removed) and charring was continued until a light grey or white ash was obtained.
After the charring process, the crucibles were allowed to cool in a desiccator and then reweighed (W2). The percentage ash content was calculated using the following equation as described by Imoisi and Michael9:
Where:
| W2 | = | Weight of crucible plus ash | |
| W1 | = | Weight of empty crucible |
Crude fat determination: Clean and dry thimble was first weighed (W1) and then 5 g of oven-dried sample was added and reweighed (W2). A round-bottom flask was filled with petroleum ether (boiling point 40-60°C) to about three-quarters of the flask's capacity. The Soxhlet extractor was then attached to a reflux condenser and the heat source was adjusted to allow the solvent to gently boil.
Next, the thimble containing the sample was placed into the Soxhlet apparatus and extraction under reflux was conducted with petroleum ether (40-60°C) for a duration exceeding 6 hrs. After completion, the thimble was carefully removed and placed in an oven at 100°C for 1 hr. Subsequently, it was cooled in a desiccator and weighed again (W3).
The percentage fat content was calculated using the following equation as described by Imoisi and Michael9:
Where:
| W1 | = | Weight of filter paper plus oven-dried residue | |
| W2 | = | Weight of sample used | |
| W3 | = | Weight of filter paper |
Crude protein determination: Approximately 1 g of the samples was carefully weighed into a micro Kjeldahl digestion flask, to which a single tablet of selenium catalyst and 15 mL of concentrated H2SO4 were added. The mixture underwent digestion on an electro-thermal heater until a clear solution was achieved, all within a fume cupboard for safety. After cooling the flask, the solution was diluted with distilled water up to 50 and 5 mL of this diluted solution were transferred into the distillation apparatus.
In a separate 100 mL conical flask (the receiver flask), 5 mL of 2% boric acid were pipetted, followed by the addition of four drops of screened methyl red indicator. To this flask, 50% NaOH was incrementally added to the digested sample until the solution turned cloudy, indicating alkalinity. Distillation commenced into the acid solution in the receiver flask, with the delivery tube positioned below the acid level. As distillation proceeded, the pink solution in the receiver flask gradually turned blue, signaling the presence of ammonia. Distillation continued until approximately 50 mL of solution remained in the round-bottom flask, at which point the condenser was rinsed with distilled water.
Subsequently, the solution in the conical flask was titrated with 0.1M HCl. The percentage of protein content was then calculated using the following equations as described by Imoisi and Michael9:
Where:
| A | = | Volume (mL) of standard HCl×Normality of standard HCl | |
| B | = | Volume (mL) of standard NaOH×Normality of standard NaOH |
Crude fiber determination: The 2.0 g (W1) of the specimen underwent defatting with petroleum ether in a separating funnel. This treated sample was then transferred into a 1 L conical flask, to which 200 mL of boiling 1.25% H2SO4 was added and gently boiled for 30 min. Subsequently, the mixture was filtered through muslin cloth and thoroughly rinsed with hot distilled water.
The filtered sample was then returned to the flask with a spatula and 200 mL of boiling 1.25% NaOH was added, followed by another gentle boiling period of 30 min. Afterward, it underwent filtration through muslin cloth, with the residue receiving thorough washing with hot distilled water, followed by rinsing with 10% HCl once and twice with industrial methylated spirit. The resulting residue was then transferred into a crucible, dried in an oven at 105°C, cooled in a desiccator and weighed (W2).
Next, the residue was ashed at 550°C for 90 mins in a muffle furnace, cooled in a desiccator and weighed again (W3). The percentage of crude fiber content was determined using the following equation as described by Imoisi and Michael9:
Where:
| W1 | = | Weight of the sample used | |
| W2 | = | Weight of the crucible plus the oven-dried sample | |
| W3 | = | Weight of the crucible plus the ash |
Determination of carbohydrate content: The percentage carbohydrate content was calculated using the following equation as cited by Ajenu et al.12.
Determination of pasting properties of samples: The pasting properties of starch were assessed using the Rapid Visco Analyser-Super 4 from Newport Scientific Pty. Ltd., Warriewood, New South Wales, Australia Analytical Scale. The STDI test profile, based on the Standard Method of the AACC (No. 61-02) for cereals’ flour, was employed to determine pasting characteristics as described by Imoisi et al.10. A slurry was prepared by mixing 3.5 g of flour with 25 mL of de-ionized water. Subsequently, a programmed heating and cooling cycle lasting 780 sec (or 13 min) was initiated. During this cycle, the starch suspension was held at 50°C, then heated to 95°C at a specified rate, maintained at 95°C for a set duration, followed by a controlled cooling phase from 95 to 50°C and finally held at 50°C for a predetermined period. The resulting pasting curve was analyzed using RVA control software, specifically Thermocline for Windows (TCW), to extract characteristic parameters including pasting temperature (PSTMP, indicating the minimum temperature required to cook the starch), peak viscosity (PV, representing the maximum paste viscosity attained during the heating stage), peak time (the duration taken to achieve PV), hot paste viscosity (HPV, also referred to as trough, indicating the minimum paste viscosity at 95°C), cool paste viscosity (CPV, denoting the final viscosity at 50°C), breakdown (BD = PV-HPV), setback (SB = CPV-HPV), stability ratio (HPV/PV) and setback ratio (CPV/HPV).
Statistical analysis: Statistical analysis was carried out with the statistical package BMDP, using the BMDP 2R program (stepwise multiple regression). Results were expressed as mean of triplicate analysis.
RESULTS AND DISCUSSION
The moisture levels of the provided samples fall below the minimum threshold (14.5%) required for proper storage. Cassava flour registers at 12.35%, while wheat flour records the highest moisture content at 12.64%, as detailed in Table 2. Consequently, these samples can endure storage for a period without succumbing to mold or staleness, particularly if kept in an airtight container13. Regarding ash content, wheat flour exhibits the highest concentration at 1.67%, whereas cassava flour displays 1.33%. Ash content reflects the mineral percentage within the samples. In terms of crude protein content, wheat flour boasts the highest at 13.36%, whereas cassava flour demonstrates the lowest at 2.74%. Cereal starches generally contain more proteins compared to those from root tubers like cassava, possibly due to the presence of gluten in wheat13. Fat content analysis reveals wheat flour with 1.5% and cassava flour with 0.95%, suggesting a potentially longer shelf life under similar conditions14. For crude fiber content, wheat flour indicates 3.13%, while cassava flour shows 1.75%, with higher fiber levels enhancing digestibility in food applications15. Lastly, carbohydrate content is notably high in both samples, with cassava flour topping the charts at 80.88%, followed by wheat flour at 66.83%. This indicates that both samples are rich energy sources, with cassava flour being particularly abundant in carbohydrates, offering more energy compared to others16.
When starch granules are heated in water past a certain critical temperature, they absorb a significant amount of water and expand to several times their original size. This process, known as gelatinization, involves crystalline melting, loss of birefringence and starch solubilization16. Gelatinization leads to the collapse of molecular order within the starch granule, accompanied by irreversible changes in properties such as granular swelling, birefringence loss and viscosity alteration17. Pasting, which follows gelatinization, encompasses granular swelling, molecular component exudation and eventual total disruption of the starch granules18. It's a temperature-dependent phenomenon, wherein granules continue to swell and ultimately rupture as temperature rises18. The pasting properties of starches from cassava flour, wheat flour and millet flours were assessed using the Rapid Visco Analyser (RVA) Super-4, revealing significant variations across all pasting parameters, including Peak viscosity, Breakdown, Trough, Setback, Final viscosity, Peak time and Pasting temperature as shown in Table 3.
| Table 2: | Proximate analysis of samples | |||
| Sample (%) | Cassava flour (CS) | Wheat flour (WT) |
| Moisture | 12.35 | 12.64 |
| Ash | 1.33 | 1.67 |
| Crude protein | 2.74 | 13.36 |
| Fat | 0.95 | 1.5 |
| Crude fibre | 1.75 | 3.13 |
| Carbohydrate | 80.88 | 66.83 |
| Table 3: | Pasting properties of cassava and wheat flours sample | |||
| Sample | PV (cP) | TV (cP) | BDV (cP) | FV (cP) | SBV (cP) | PKT (min) | PST (°C) | STB ratio | SB ratio |
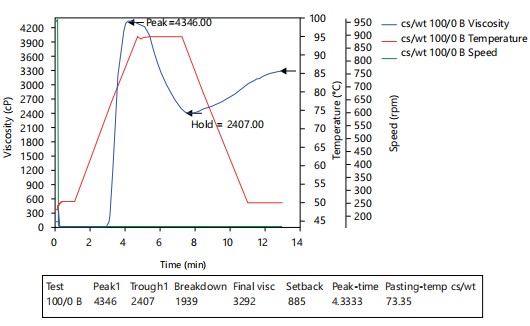
| CS (100%) | 4346 | 2407 | 1939 | 3292 | 885 | 4.3333 | 73.35 | 0.5538 | 1.3677 |
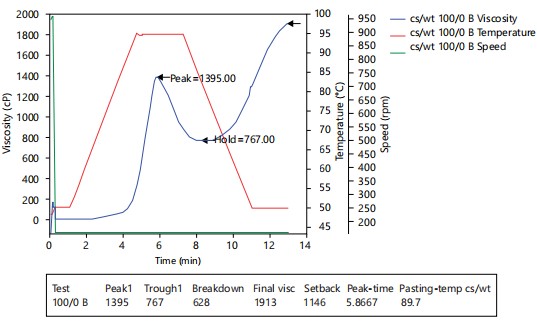
| WT (100%) | 1395 | 767 | 628 | 1913 | 1146 | 5.8667 | 89.7 | 0.5498 | 2.4941 |
| CS: Cassava flour, WT: Wheat flour, PV: Peak viscosity, TV: Trough viscosity, BDV: Breakdown viscosity (i.e. PV-TV), FV: Final viscosity, SBV: Setback viscosity (i.e. FV-TV), PKT: Peak time, PST: Pasting temperature, cP: Centipoises i.e. units of viscosity, STB ratio: TV/PV (stability ratio) and SB ratio: FV/TV (setback ratio) viscosity unit is either in centipoises (cP) or Rapid Visco Units (RVU) But 1RVU: 12 cP | |||||||||
|
|
Viscosity gradually increased with rising temperature, attributed to water removal from exuded amylose by the swelling granules19. Peak Viscosity (PV), indicating water-binding capacity, ranged from 1395 to 4346 cP, with the highest observed in cassava flour starch. Breakdown Viscosity [(BD), i.e., (PV-TV)] showed significant variation as shown in Fig. 1 and 2, respectively, suggesting starch granule disintegration during shear force and heating17. Lower amylose levels resulted in higher breakdown viscosity. Trough Viscosity (TV) represented minimum viscosity at constant high temperature, with wheat flour exhibiting the lowest and cassava flour the highest viscosity20.
The setback Viscosity [(SB), i.e., (FV-TV)] ranged from 885 to 1146 cP, indicating reassociation of amylose or amylopectin molecules during cooling16. Final Viscosity (FV) stabilized at 1769 to 3292 cP, reflecting the material’s ability to form a viscous paste or gel after cooking and cooling. Pasting temperature ranged from 73.35 to 89.7°C, with cassava flour having the lowest and wheat flour the highest temperature.
|
Peak-time indicated the time to achieve peak viscosity, with cassava flour achieving it fastest17. Stability ratio (TV/PV) explained resistance to viscosity breakdown under shear, with cassava flour starch showing improved granule organization6. Setback Ratio (FV/TV), reflecting retrogradation tendency after gelatinization, was lowest for cassava flour and highest for wheat flour9. Molecular interactions post-cooling, known as retrogradation, contribute to gel formation, texture and film properties of the final product13.
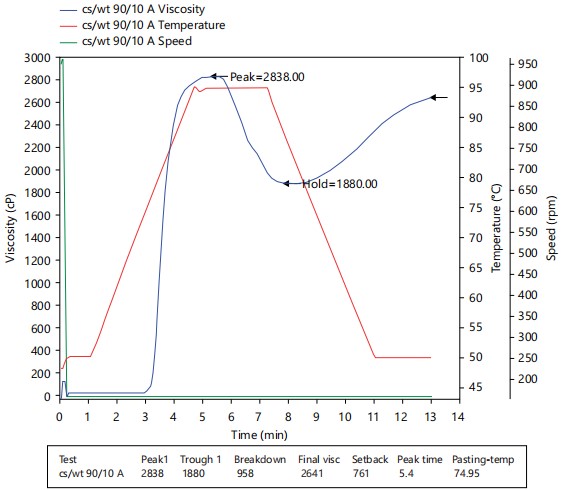
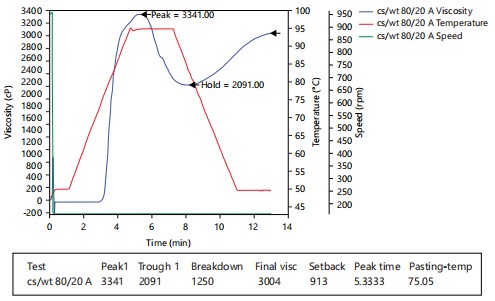
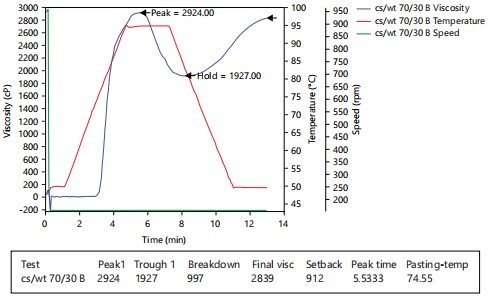
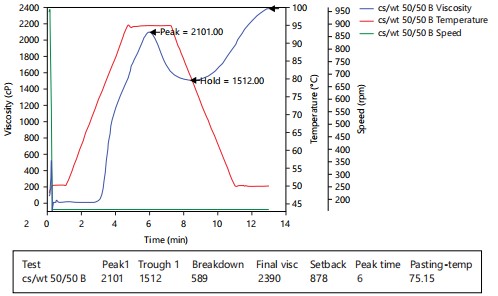
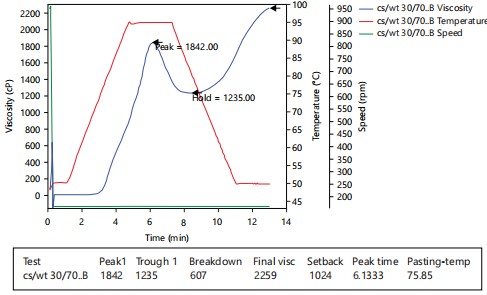
The pasting properties of starches derived from cassava flour, wheat flour and their blends were analyzed using the Rapid Visco Analyser (RVA) Super-4 and the results were summarized in Table 4 and Fig. 3-7, respectively. Notably, there were significant variations observed in all pasting parameters among the starches obtained from cassava flour and wheat flour samples21. The viscosity of starch suspensions exhibited a gradual increase with rising temperature, which could be attributed to the dehydration of amylose molecules leading to granule swelling8.
The Peak Viscosity (PV), reflecting the water-binding capacity and disintegration ease of starch granules, ranged from 1395 to 4346 cP across different composite flour samples as shown in in Table 4, with the lowest observed in pure wheat flour and the highest in pure cassava flour starch15. This trend indicated a decrease in PV values with increasing wheat flour content, suggesting reduced water-binding capacity and swelling capacity due to higher amylose content in wheat flour. Breakdown Viscosity (BD), representing the disintegration of gelatinized starch granule structure under shear force and heating, decreased as cassava flour was replaced with wheat flour, indicating the higher amylose content in wheat flour22. Similarly, Trough Viscosity (TV), indicative of starch granule stability at maximum temperature, decreased with increasing wheat flour ratio, signifying increased breakdown in starch granules23.
|
|
| Table 4: | Pasting properties of cassava flour, wheat flour and their blends (cs/wt)% | |||
| Sample (%) | PV (cP) | TV (cP) | BDV (cP) | FV (cP) | SBV (cP) | PKT (mins) | PST (°C) | STB ratio | SB ratio |
| CS/WT(100/0) | 4346 | 2407 | 1939 | 3292 | 885 | 4.3333 | 73.35 | 0.5538 | 1.3677 |
| CS/WT(90/10) | 2838 | 1880 | 958 | 2641 | 761 | 5.4 | 74.95 | 0.6624 | 1.4048 |
| CS/WT(80/20) | 3341 | 2091 | 1250 | 3004 | 913 | 5.3333 | 75.05 | 0.6259 | 1.4366 |
| CS/WT(70/30) | 2924 | 1927 | 997 | 2839 | 912 | 5.5333 | 74.55 | 0.659 | 1.4733 |
| CS/WT(50/50) | 2101 | 1512 | 589 | 2390 | 878 | 6 | 75.15 | 0.7197 | 1.5807 |
| CS/WT(30/70) | 1842 | 1235 | 607 | 2259 | 1024 | 6.1333 | 75.85 | 0.6705 | 1.8291 |
| CS/WT(0/100) | 1395 | 767 | 628 | 1913 | 1146 | 5.8667 | 89..7 | 0.5498 | 2.4941 |
| CS: Cassava flour, WT: Wheat flour, PV: Peak viscosity, TV: Trough viscosity, BDV: Breakdown viscosity (i.e. PV-TV), FV: Final viscosity, SBV: Setback viscosity (i.e. FV-TV), PKT: Peak time, PST: Pasting temperature, STB ratio: (TV/PV) Stability ratio, SB ratio: (FV/TV) Setback ratio and cP: centipoises i.e. units of viscosity | |||||||||
|
|
Setback Viscosity (SB), reflecting the recrystallization of gelatinized starch during cooling, showed fluctuating values as the wheat flour ratio in the blend increased. Final Viscosity (FV), denoting the starch's ability to form a viscous paste and indicating product texture, decreased with higher wheat flour content due to reduced amylose content6.
Pasting Temperature, Peak Time, Stability Ratio (FV/TV) and Setback Ratio were also analyzed. Pasting temperature increased with higher wheat flour content, while peak time increased, indicating reduced swelling rate24. Stability Ratio showed improved organization within starch granules at 50/50 blend ratio, leading to more gradual swelling and less mechanical damage2. Setback Ratio increased with higher wheat flour inclusion, indicating a higher tendency for retrogradation in blends16.
CONCLUSION
Based on the findings of the proximate analysis, it is conceivable that the protein content of the cassava/wheat flour blend would show improvement. The outcomes of the pasting parameters also indicate enhanced stability in the blend, while the retrogradation ability of the flour was mitigated due to the blend. Consequently, these modifications suggest improved texture and enriched nutritional benefits in the application of the product.
SIGNIFICANCE STATEMENT
This study holds significant implications for both economic and agricultural sectors, particularly in regions abundant in cassava production. By investigating the physico-chemical properties of cassava and wheat flours and exploring their composite blends, the research sheds light on viable strategies for leveraging cassava resources to enhance food product formulations. The findings not only contribute to the diversification of food offerings but also hold promise for catalyzing job creation along the production value chain, thereby bolstering both local economies and national GDP. Furthermore, the identification of distinct parameters for cassava and wheat flours underscores the potential for tailored applications in food formulation, offering avenues for value addition and product differentiation in the food industry.
REFERENCES
- Afoakwa, E.O., E.J. Kongor, G.A. Annor and R. Adjonu, 2010. Acidification and starch behaviour during co-fermentation of cassava (Manihot esculenta Crantz) and soybean (Glycine max Merr) into gari, an African fermented food. Int. J. Food Sci. Nutr., 61: 449-462.
- Agbon, C.A., E.O. Ngozi and O.O. Onabanjo, 2010. Production and nutrient composition of fufu made from a mixture of cassava and cowpea flours. J. Culinary Sci. Technol., 8: 147-157.
- Ceballos, H., T. Sanchez, N. Morante, M. Fregene and D. Dufour et al., 2007. Discovery of an amylose-free starch mutant in cassava (Manihot esculenta Crantz). J. Agric. Food Chem., 55: 7469-7476.
- Imoisi, C., J.U. Iyasele and S.E. Okhale, 2021. Proximate and acute toxicity profile of Vitex doniana (black plum) fruit. J. Chem. Soc. Nigeria, 46: 276-282.
- Imoisi, C., J.U. Iyasele, E.E. Imhontu, U.R. Orji and S.A. Okhale, 2021. Phytochemical and antioxidant capability of vitex doniana (black plum) fruit. J. Chem. Soc. Nigeria, 45: 191-196.
- Charles, A.L., Y.H. Chang, W.C. Ko, K. Sriroth and T.C. Huang, 2004. Some physical and chemical properties of starch isolates of cassava genotypes. Starch Starke, 56: 413-418.
- Egbeneje, V.O., S.E. Okhale, C. Imoisi, I.O. Ogbogo and O. Ojo, 2023. Evaluation of the inhibitive properties of silver nanoparticles in Senna occidentalis root extract as corrosion inhibitor of mild steel. Tanzania J. Sci., 49: 655-663.
- Curvelo, A.A.S., A.J.F. de Carvalho and J.A.M. Agnelli, 2001. Thermoplastic starch-cellulosic fibers composites: Preliminary results. Carbohydr. Polym., 45: 183-188.
- Imoisi, C. and U.C. Michael, 2020. Comparative physicochemical and proximate analyses of different extracts of Persea americana. J. Chem. Soc. Niger., 45: 1139-1146.
- Imoisi, C., J.U. Iyasele, E.E. Imhontu, D.O. Ikpahwore and A.O. Okpebho, 2020. Pasting properties of composite of cassava and wheat flours. J. Chem. Soc. Nigeria, 45: 1157-1163.
- Imoisi, C., J.U. Iyasele, U.C. Michael and E.E. Imhontu, 2020. The effects of watermelon rind flour on the functional and proximate properties of wheat bread. J. Chem. Soc. Niger., 45: 978-986.
- Ajenu, C.O., C. Imoisi, E.E. Imhontu and U.R. Orji, 2021. Comparative evaluation of the proximate and micro-nutritional benefits of pawpaw, carrots, turmeric and coconut. J. Food Technol. Nutr. Sci., 3.
- Chinyere, I., I.U. Julius and O.E. Samuel, 2021. Determination of the flavoring components in Vitex doniana fruit following hydrodistillation extraction. Am. J. Food Nutr., 9: 69-75.
- Imoisi, C., J.U. Iyasele, D.O. Ikpahwore and A.O. Okpebho, 2023. The effects of watermelon rind flour on the proximate properties of wheat cake. Int. J. Nutr. Res. Health, 2.
- Daramola, B. and K.O. Falade, 2006. Enhancement of agronomical values: Upstream and downstream opportunities for starch and starch adjuncts. Afr. J. Biotechnol., 5: 2488-2494.
- Josiah, J.G., J.Y. Adama, Z. Jiya, O.M. Abah and C. Imoisi, 2023. In vitro anthelmintic activities of stem and root barks extracts of Parkia biglobosa on infective larvae and adult of Haemonchus contortus. Afr. J. Biotechnol., 22: 26-38.
- Daramola, B. and S.A. Osanyinlusi, 2006. Production, characterization and application of banana (Musa spp) flour in whole maize. Afr. J. Biotechnol., 5: 992-995.
- Delcour, J.A., J. Vansteelandt, M.C. Hythier and J. Abécassis, 2000. Fractionation and reconstitution experiments provide insight into the role of starch gelatinization and pasting properties in pasta quality. J. Agric. Food Chem., 48: 3774-3778.
- Imoisi, C., J.U. Iyasele and A.O. Okpebho, 2023. The effects of citrus vesicle flour on the functional and proximate properties of cassava bread. Pak. J. Nutr., 22: 19-26.
- Ajenu, C.O., M.E. Ukhun, C. Imoisi, E.E. Imhontu, L.E. Irede and U.R. Orji, 2021. Characterization and stability studies of egusi melon seed oil (Citrullus colocynthis L.). J. Chem. Soc. Nigeria, 46: 238-244.
- Josiah, J. Gana, Adama, J. Yisa, E.H. Edim, I. Chinyere and J. Zipporah, 2024. Acute toxicity profile of crude methanolic stem bark extract of Parkia biglobosa in West African dwarf (wad) goats. J. Biosci. Biotechnol. Discovery, 9: 10-22.
- Ozoh, C.A., C. Imoisi and J.U. Iyasele, 2023. Effect of pH and duration of fermentation on the quality characteristics of garri. Pak. J. Nutr., 22: 45-51.
- Okhale, S.E., P.O. Oladosu, M.I. Aboh, C. Imoisi and J.J. Gana, 2022. In-vitro evaluation of Eucalyptus citriodora leaf essential oil and extracts on selected pathogens implicated in respiratory tract infections. Int. J. Pharmacogn., 9: 195-201.
- Chinyere, I. and I.U. Julius, 2020. Spectroscopic determination of sugar components of Vitex doniana fruit syrup following derivatization. Nat. Sci., 18: 67-76.
How to Cite this paper?
APA-7 Style
Omenai,
F.I., Imoisi,
C., Iyasele,
J.U. (2024). Physico-Chemical and Pasting Characteristics of Cassava, Wheat Flours and Their Composite Blends. Asian Science Bulletin, 2(4), 333-344. https://doi.org/10.3923/asb.2024.333.344
ACS Style
Omenai,
F.I.; Imoisi,
C.; Iyasele,
J.U. Physico-Chemical and Pasting Characteristics of Cassava, Wheat Flours and Their Composite Blends. Asian Sci. Bul 2024, 2, 333-344. https://doi.org/10.3923/asb.2024.333.344
AMA Style
Omenai
FI, Imoisi
C, Iyasele
JU. Physico-Chemical and Pasting Characteristics of Cassava, Wheat Flours and Their Composite Blends. Asian Science Bulletin. 2024; 2(4): 333-344. https://doi.org/10.3923/asb.2024.333.344
Chicago/Turabian Style
Omenai, Frederick, Ideyienmhi, Chinyere Imoisi, and Julius Uche Iyasele.
2024. "Physico-Chemical and Pasting Characteristics of Cassava, Wheat Flours and Their Composite Blends" Asian Science Bulletin 2, no. 4: 333-344. https://doi.org/10.3923/asb.2024.333.344

This work is licensed under a Creative Commons Attribution 4.0 International License.