
Impact of Tar Saturation on Fracture Networks and Reservoir Quality: Integrated Structural and Petrophysical Analysis of the Asmari Formation
-
Zohreh Movahed


Springer, Alzare, Toronto, Canada
| Received 09 Jul, 2025 |
Accepted 02 Sep, 2025 |
Published 30 Sep, 2025 |
Background and Objective: The Asmari fractured reservoir in Iran presents significant challenges for reservoir characterization due to complex structural heterogeneities and the presence of tar. Conventional techniques such as core sampling and standard logging often fall short in predicting permeability and production behaviour within such intricate reservoirs. This study integrates formation micro imager (FMI) data with petrophysical analysis to assess fracture properties, permeability, and evaluate the impact of tar on reservoir performance. Materials and Methods: The MI logs, combined with conventional petrophysical logs, were employed to analyse structural dips, fracture orientations, and reservoir heterogeneity. Bright and conductive features in FMI images were examined using sinusoid fitting techniques, and heterogeneity indices were computed via specialized software. Permeability analyses compared FMI-derived indicators with core measurements, while tar effects were assessed through resistivity contrasts and gamma log responses. Results: Structural analysis identified dips of approximately 46° towards S20W and fracture strikes oriented N83E-S83W. Longitudinal open fractures, predominantly in Zones 6 and 7-1, exhibited apertures up to 1 mm. High FMI resistivity values within porous dolomite layers correlated strongly with the presence of tar and heavy oil, causing permeability overestimation and impaired fluid mobility. Despite elevated porosity in carbonate and dolomite sections, tar occupation of pore spaces significantly reduces effective permeability. Conclusion: The FMI logging offers critical insights into fractures, heterogeneity, and permeability variations influenced by tar saturation. These findings advance the understanding of the Asmari reservoir’s complex carbonate framework, facilitating optimized production strategies for fractured, tar-affected reservoirs.
INTRODUCTION
The investigation of fractures within the Asmari reservoir continues to be a critical and challenging area of research in petroleum geology due to the significant role fractures play in influencing the reservoir’s behavior and performance. Fractures serve as key pathways for fluid flow, greatly impacting petroleum migration, accumulation, and production efficiency. Despite extensive studies, the complex interplay of geological, structural, and petrophysical factors within the Asmari reservoir has made it difficult to fully understand the mechanisms governing fracture development and their contributions to reservoir dynamics. This ongoing challenge underscores the importance of integrating advanced analytical techniques and multidisciplinary approaches to unravel the intricate characteristics of fractures in this prolific yet complex carbonate reservoir.
Fractured reservoirs inherently display distinctive behaviors, with fractures serving as critical elements that significantly influence and regulate the overall dynamics of the reservoir. When fractures remain open, they function as pathways for petroleum migration, enabling the development of highly productive zones characterized by permeability values exceeding 10,000 millidarcys (mD).
The Asmari reservoir presents a complex and multifaceted challenge, attributed to its medium to high porosity dolomite layers, intricate lithological diversity, the presence of tar and organic-rich shale, and the compartmentalized nature of the formation. These characteristics add significant complexity to interpreting production behavior and pose challenges to achieving a comprehensive understanding of the reservoir’s full potential. The complexity is further amplified by the presence of dissolution channels and fractures, which contribute additional variability to the reservoir’s fluid flow dynamics and storage capacities.
Formation heterogeneity is a pivotal factor influencing the performance of the Asmari reservoir, making its understanding essential for improving the precision of production forecasts. Conventional methods for evaluating carbonate formations, which primarily depend on resistivity and porosity logs, often fall short in capturing the intricate and multifaceted nature of the reservoir’s heterogeneity.
Moreover, the potential of formation micro-imager (FMI) logs for evaluating formation heterogeneity has yet to be fully realized. While FMI data have proven valuable in other geological contexts, their application within carbonate reservoirs remains an area of ongoing investigation. The extent to which FMI logs can effectively identify and quantify small-scale heterogeneity in these complex formations is still not well understood, highlighting the need for further research and methodological advancements.
In numerous carbonate reservoirs, a notable inconsistency exists between hydrocarbon production and the correlation of density-neutron logs. This paradox is especially evident in older carbonate oil fields, where production frequently surpasses expectations based on conventional porosity log interpretations alone. In certain cases, high-production zones are found in areas where porosity logs suggest low porosity, while regions with higher porosity exhibit lower production levels. This discrepancy highlights the need for a more refined approach to reservoir characterization that goes beyond traditional log analysis. This study seeks to overcome these challenges by introducing an innovative approach to enhance reservoir characterization in the Asmari field. Through the integration of FMI data with traditional petrophysical logs, the objective is to quantify small-scale heterogeneity and gain a more refined understanding of the reservoir’s production behavior. This approach holds the potential to offer more precise insights into the reservoir’s structural and petrophysical attributes, ultimately contributing to the development of improved predictive models and more effective recovery strategies. By enhancing our interpretation of the reservoir’s complexity, this method may lead to optimized exploration and production outcomes. The main objective of the FMI survey was to evaluate structural dips, characterize fractures, and determine the distribution, types, and orientation of fractures, along with a texture and heterogeneity analysis based on the images. The study integrated image logs with open hole logs to analyze key characteristics of the Asmari carbonates, such as structural features, fracture characterization, secondary porosity (due to vugs/moulds), and permeability.
MATERIALS AND METHODS
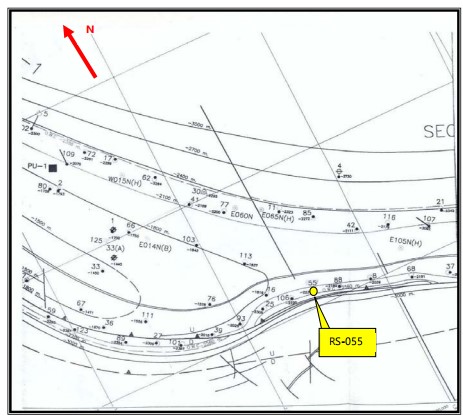
Data collection and study area: This investigation focuses on Well RS-055, located in the southwestern sector of the Rag-e-Safid Field, Khuzestan Province, Iran, near a significant regional fault (Fig. 1). The well was drilled vertically using a 6.125-inch bit with a maximum deviation of 25 degrees, targeting the Asmari Formation, the primary reservoir unit in the area. Fig. 1 presents the geographic location of well RS-055 within the Rag-e-Safid Field, illustrating its proximity to major structural features relevant to fracture development.
Drilling operations utilized a water-based mud system to maintain wellbore stability and ensure optimal logging conditions. Schlumberger performed a full-bore formation micro imager (SFMI) logging run from 2430 to 2733 m depth on 16 December, 2009. Initial processing and interpretation of the logging data were conducted in June, 2010 using Geoframe software, with further advanced analyses undertaken in 2024.
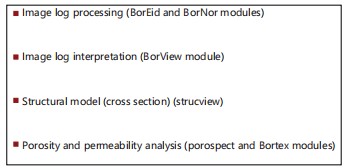
The SFMI survey aimed to determine the structural dip, comprehensively characterize fractures, and analyze porosity systems, permeability variations, and reservoir heterogeneity within the Asmari Formation. Advanced image processing techniques were applied to extract fracture orientations, apertures, and spatial distributions. These data were integrated with conventional open-hole logs to achieve refined interpretations of reservoir fabric and fluid flow behavior, as summarized in the workflow depicted in Fig. 2. This figure clearly outlines the sequential stages of data acquisition, processing, geological and petrophysical interpretation, offering a structured methodological approach for the study.
Data sets utilized:
| • | Electrical SFMI borehole image logs over the 2430–2733 m depth interval | |
| • | HRLA, Sonic, TLD, and MCFL logging datasets covering the same depth interval | |
| • | Formation tops supplied by the client: | |
| • | Asmari Zone 4 at 2436 m | |
| • | Asmari Zone 5 at 2456 m | |
| • | Asmari Zone 6 at 2520 m | |
| • | Asmari Zone 7-1 at 2644 m | |
| • | Asmari Zone 7-2 at 2708 m |
Data quality and validation: The SFMI image logs were acquired through standard wireline logging protocols. Key parameters such as depth calibration, caliper measurements, borehole inclination, and resistivity were carefully validated. Image quality was generally high; however, some intervals exhibited borehole irregularities or wall breakouts, causing imperfect pad contact. Inclinometry data were confirmed to be within acceptable limits, supporting reliable orientation measurements.
In porous intervals containing heavy oil, resistivity anomalies manifested as high values on SFMI images. The limited depth of investigation of the FMI tool revealed unflushed oil zones as bright white patterns, indicating elevated resistivity relative to surrounding rock. These observations provided important context for interpreting resistivity behaviour in tar-affected formations.
Data processing and interpretation workflow
Borehole image processing
Image correction: The SFMI images were processed to correct tool-related artifacts, such as logging speed variability and tool sticking. Images were then equalized and normalized to enhance geological feature visibility.
|
|
Resistivity calibration: The SFMI resistivity data were calibrated against shallow laterolog or spherically focused resistivity logs to improve accuracy in detecting heterogeneity, porosity, and permeability.
Depth matching: Depth alignment between images and logs was adjusted to a reference depth log to account for acquisition speed differences and tool sticking events, ensuring consistent correlation across datasets.
Geological interpretation
Bedding and structural dip: Bedding planes were interpreted from resistive and conductive patterns in SFMI images. Structural dip and strike were analysed using software tools such as Strucview*, supplemented by statistical visualization methods.
Fracture characterization: Natural fractures identified on SFMI images were categorized by dip, aperture (open, sealed, mineral-filled), and stratigraphic context, accounting for depositional environment to enhance geological accuracy.
Petrophysical interpretation
Porosity evaluation: Secondary and high-resolution porosity systems in the carbonate formation were examined through integration of SFMI images with porosity and resistivity logs. Porosity distribution maps were generated using Porospect software to differentiate primary matrix porosity from secondary porosity.
Reservoir heterogeneity: Combined analysis of SFMI images and open-hole logs assessed reservoir heterogeneity, distinguishing conductive and resistive zones. BorTex* software facilitated the classification and visualization of heterogeneity features.
Permeability mapping: Spatial permeability variations were inferred from heterogeneity data extracted via BorTex*, enabling enhanced understanding of reservoir quality and flow capacity (Fig. 2).
RESULTS
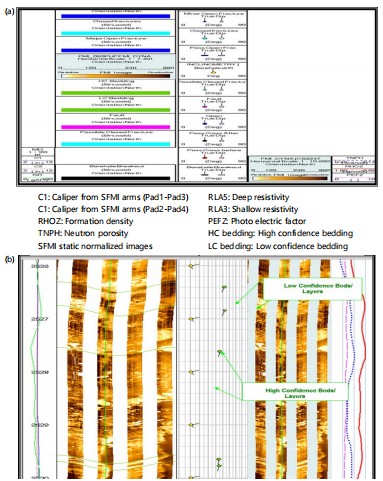
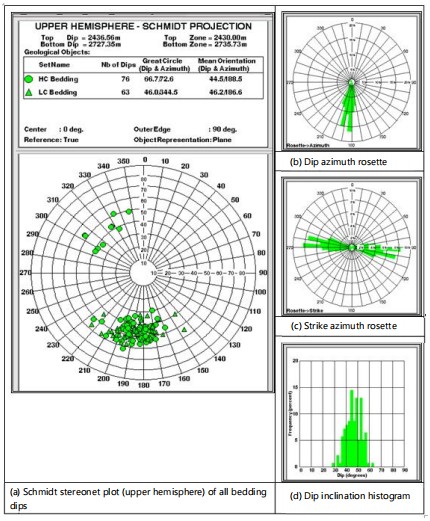
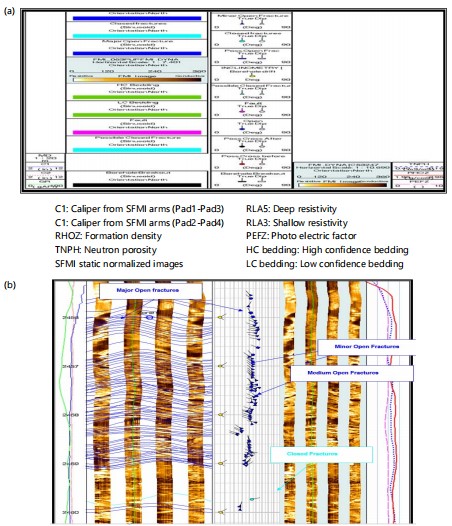
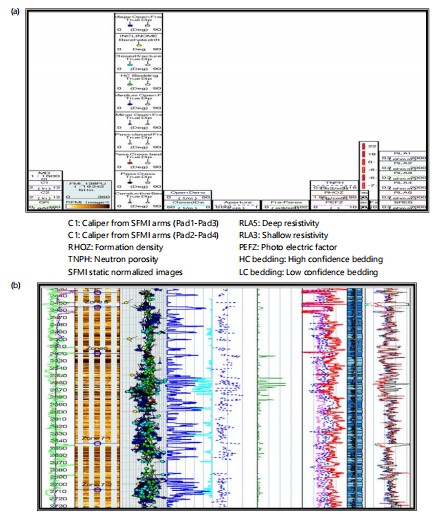
Geological characterization: The Asmari Formation within the logged interval exhibits generally consistent bed boundaries. Conductive zones corresponding to bedding planes form conductive seams primarily influenced by marly and shaly interbeds between anhydrite layers. These intervals are associated with elevated CGR values and borehole washouts observed in caliper logs. Sharp boundaries frequently occur at contacts between marly/shaly and anhydrite units, showing planar surfaces typical of marl-limestone sequences. Thin, dense, and highly resistive streaks were also noted within carbonate sections. Bedding classification was performed based on dip reliability, resulting in 76 high confidence (HC) and 63 low confidence (LC) bedding planes (Fig. 3). Figure 3a illustrates header information emphasizing structural dip measurements and fracture identification, while Fig. 3b shows SFMI images revealing layering patterns with dips categorized by confidence levels (green circles for HC and green triangles for LC).
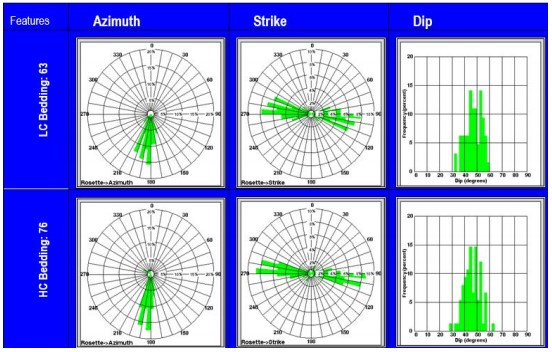
Analysis of bedding and structural dips: The Asmari Formation encountered in this well exhibits a complex mix of rock types, predominantly consisting of carbonate rocks such as limestone and dolomite, along with smaller amounts of clastic materials like sandstone and shale. This research examines the section between depths of 2430 and 2733 m, covering a logged, processed, and analysed thickness of 303 m. The formation shows distinct stratification, which has been divided into three separate zones based on slight variations in bedding dip angles. In total, 76 bedding planes were identified as high confidence (HC), with dip angles ranging from 28-64°, averaging roughly 46°. Analysis of dip azimuths revealed orientations spanning from S15°E to S30°W, with the most frequent dip direction approximately S5°W. Additionally, 63 bedding planes were categorized as low confidence (LC), with dip angles varying between 32 and 60°, and an average of 48°. The dominant dip azimuth for the low-confidence (LC) features is also oriented toward S5°W. When both high-confidence (HC) and LC bedding data are combined, the average structural dip is determined to be 44°, with a general dip direction of S5°W (Table 1, Fig. 3-5). Statistical charts in Fig. 4 present dip angle distributions for HC and LC groups, while Fig. 5 offers detailed structural analysis with Schmidt plots, rose diagrams for dip and strike azimuths, and histograms of dip inclination values. Figure 5 collectively supports the average dip interpretation of 44° toward S5°W as representative for the formation.
The dips of the layers and bed boundaries are classified into high and low confidence categories depending on the clarity and flatness of the boundaries. High confidence dips are indicated by green circular tadpoles, while low confidence dips are shown as green triangular tadpoles in the Asmari Formation.
|
| Table 1: | Bedding boundary structural parameters | |||
| Formation | Feature type | Number of samples |
Symbol | Dominant dip azimuth |
Dominant strike |
Dominant dip inclination (deg.) |
Figure | Explanation |
| Asmari | HC bedding | 75 | HC bedding |
S5W | N85W-S85E | 46 (Range 28-64) | Fig. 4 | Based on the statistical plot |
| LC bedding | 64 | LC bedding |
S5W | N85W-S85E | 48 (Range 32-60) | Fig. 4 | Based on statistical plot |
Fault characterization and analysis: The identification of minor reverse faults on the images is based on several key factors, which include:
| • | Abrupt changes in dip attitude: Significant shifts in either the magnitude or azimuth of the dip across the fault plane, indicating a structural disturbance | |
| • | Sudden change in borehole drift or deviation azimuth: A noticeable change in the direction of the borehole as it crosses the fault, suggesting a displacement |
|
Plots also include the count of features associated with each dip category
| • | High-angle conductive or resistive anomalies: These features appear at steep angles relative to the wellbore and typically suggest the presence of a fault. Variations in rock composition and properties along a fault can lead to noticeable changes in resistivity | |
| • | Borehole enlargement at fault intersections: When the wellbore crosses a fault zone, the borehole may widen due to mechanical instability or displacement caused by the fault movement | |
| • | Change in the orientation of in-situ stress: Fault zones can alter the surrounding stress field, resulting in a noticeable deviation in the natural stress direction or magnitude near the fault | |
| • | Sudden discontinuity of geological layers: Rock strata may abruptly end or become offset at a fault, serving as a clear indicator of fault-related displacement | |
| • | Changing thickness of fault-bounded layers: Faults can cause variations in the thickness of layers across the wellbore due to differential movement along the fault | |
| • | Occurrence of fractures: Fault zones are often associated with fractures, which can be identified in the borehole images | |
| • | Abrupt changes in log response: Faults cause a distinct change in the response of logs, such as resistivity, density, or porosity, across the fault plane | |
| • | Abrupt change in formation pressure (if sealing fault): If the fault is sealing, it will cause a sudden change in formation pressure, as the flow of fluids is restricted across the fault |
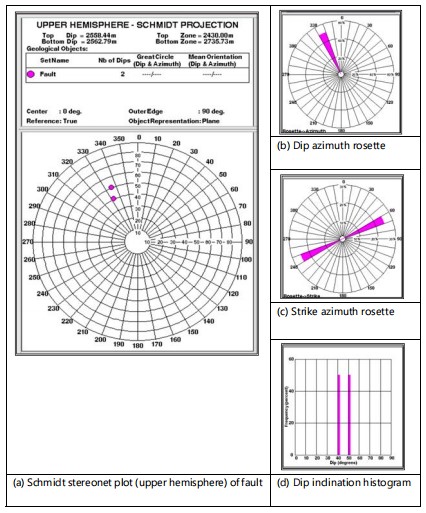
A specific fault is interpreted between depths of 2558.5 and 2662.8 m, primarily due to the following factors:
| • | Variation in dip angles: The faulted zone exhibits a dip of 40-50° toward N25W, which contrasts sharply with the adjacent rock layers that dip gently-around 5° to the Southwest. This significant difference in dip direction and angle is a strong sign of fault activity | |
| • | Sudden shift in log signatures: A noticeable change in the geophysical log readings occurs across the fault contact, providing additional evidence of fault displacement |
|
| • | Fractures: Fractures are observed in the vicinity of the fault, suggesting movement and disruption of the rock layers | |
| • | Termination of layers: Several layers abruptly terminate at the fault plane, a common feature in fault zones (Fig. 6) |
Attributes of the fault are discussed below:
| • | Dip: Two fault planes are identified, both dipping to the N25W at inclinations of 40 and 50° | |
| • | Depth: The faults intersect the well at depths of 2558.5 and 2662.8 m, as shown in Fig. 6-9 |
|
Fault orientation and distribution statistics are visualized in Fig. 7 through:
| • | Schmidt stereonet plot (Fig. 7a) | |
| • | Dip azimuth rose diagram (Fig. 7b) | |
| • | Strike azimuth rose diagram (Fig. 7c) | |
| • | Dip inclination histogram (Fig. 7d) |
These figures collectively characterize the structural complexity and tectonic features within the formation.
The observed variability in dip azimuths arises from a combination of sedimentary architecture, tectonic deformation, and diagenetic processes, including cementation, dissolution, recrystallization, and compaction. These processes cause localized distortions, complicating the establishment of uniform structural trends.
|
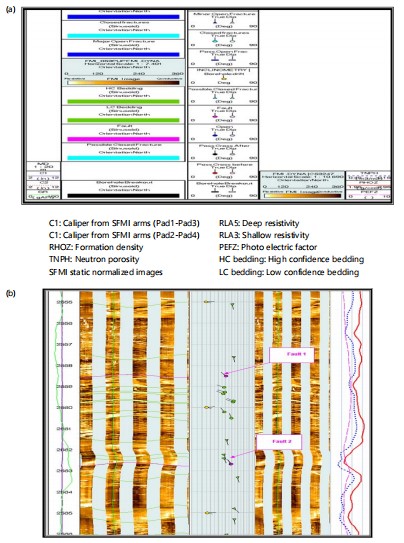
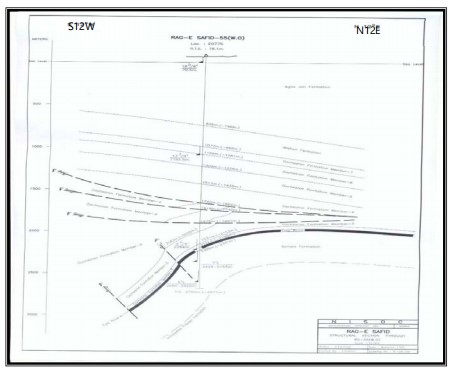
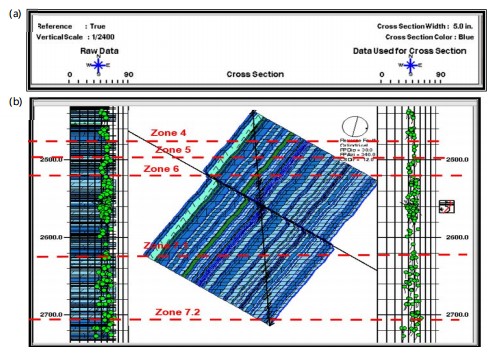
Figure 8 provides a detailed NISOC cross-section of well RS-055, illustrating subsurface stratigraphy, lithological variations, and structural features including faulting and bedding orientations. This visualization aids in understanding the reservoir’s architecture and fluid migration pathways.
Validation of the structural interpretation was performed by comparing Strucview cross-section analysis with the NISOC field data, showing high consistency. Figure 9a presents header details of the well, while Fig. 9b displays the Strucview-generated structural cross-section, confirming a dominant dip of 44° towards S5°W.
This alignment validates the reliability of the structural model, essential for accurate reservoir characterization and development planning.
The observed variations in dip azimuth within the Asmari formation are closely tied to its complex sedimentary architecture and the dynamic processes that have shaped it over time. The sedimentary structure inherently exhibits a capacity for significant dip angle fluctuations, reflecting the variability in depositional environments and post-depositional modifications. Bedding dips and strike trends across the formation display a high degree of variability, posing challenges to establishing a uniform structural trend.
|
|
These inconsistencies likely stem from a combination of factors, including depositional dynamics, tectonic influences, and subsequent diagenetic alterations. Diagenesis, particularly within the limestone components of the Asmari Formation, plays a critical role in these variations. Processes such as cementation, dissolution, recrystallization, and compaction have contributed to the modification of the original bedding structures, further amplifying the spread in dip azimuths. These diagenetic alterations have introduced localized distortions in bedding orientation, complicating efforts to delineate a consistent geological framework. To visualize and analyse these complex variations, a computer-generated cross-section (Strucview) was constructed along the NNE-SSW plane. This cross-section reveals uneven bedding surfaces, marked by irregular geometries that are characteristic of diagenetic modifications. These surfaces highlight the interplay between sedimentary processes and diagenetic transformations, offering a detailed snapshot of the structural heterogeneity within the formation. Overall, the combined influence of depositional variability, tectonic activity, and diagenetic processes has resulted in a highly complex dip and strike pattern, underscoring the Asmari Formation’s geological intricacy. This complexity necessitates advanced analytical tools and techniques to interpret and model its structural characteristics accurately.
Figure 8 presents a detailed cross-section for well #RS-055 located in the Rag-e-Safid Field, provided by the National Iranian South Oil Company (NISOC). This cross-section offers an in-depth view of the subsurface stratigraphy, revealing the geological layers encountered during drilling, along with the structural features that define the area. It highlights the lithological variations across the formation, showcasing the different rock types and their distribution. The visualization also captures key geological units, including the faulting patterns and bedding orientations, which play a critical role in shaping the structural framework of the Rag-e-Safid Field. These features are essential for understanding the reservoir’s architecture, as they influence fluid migration, reservoir connectivity, and hydrocarbon potential. The detailed data presented in this cross-section serves as a vital reference for geologists and engineers, providing valuable insights into the subsurface conditions and aiding in the interpretation of the field’s geological characteristics and the identification of potential hydrocarbon reserves.
This cross-section illustrates the subsurface stratigraphy, structural features, and lithological variations encountered in the well. The visualization highlights key geological units, faulting patterns, and bedding orientations, offering critical insights into the reservoir architecture and structural framework of the Rag-e-Safid Field. This data serves as a foundational reference for interpreting the geological characteristics and potential hydrocarbon prospects of the area.
The results from the Strucview analysis (Fig. 9) were compared and closely correlated with the structural cross-section provided by the National Iranian South Oil Company (NISOC). This comparison reveals a high degree of consistency between the two datasets, which validates the accuracy of the structural interpretations derived from both sources. Strucview, a sophisticated tool for structural modelling, employs advanced computational techniques and algorithms to interpret critical geological features such as bedding dips, fault patterns, and other subsurface characteristics in a three-dimensional space. The fact that the Strucview analysis closely matches the NISOC cross-section further reinforces the reliability of the structural interpretations made for the Asmari Formation.
This alignment between the field data and the computational modelling suggests that both the observed geological features and the model-generated results reflect a unified structural framework, which is crucial for precise reservoir characterization. The validation of the structural dip data through Strucview not only ensures the integrity of the interpretations but also enhances overall confidence in the geological modelling of the Asmari Formation. As a result, these corroborated findings significantly improve the reliability of the geological insights derived from these analyses. This enhanced confidence is vital for supporting informed decision-making related to exploration, development, and production strategies in the region, ultimately aiding in more efficient and accurate resource management and development.
The analysis identifies a 44° dip towards S5W as the most representative inclination for the Asmari Formation, offering valuable insights into its structural and tectonic characteristics.
Analysis of natural fractures: Fractures are planar discontinuities in rock that show no visible displacement of adjacent blocks along the fracture surfaces. These features can vary in aperture, appearing open, tightly closed, or infilled with minerals such as clay, calcite, anhydrite, or pyrite. In this study, fracture characterization was a primary objective of the schlumberger full-bore formation micro imager (SFMI) survey conducted in the well. To ensure a comprehensive understanding of fracture development and distribution, image logs were analysed alongside conventional open-hole log data. The following sections discuss various attributes of these fractures in detail. In general, the term “fracture” refers to any mechanical break or discontinuity in the rock that is not sedimentary in origin and reflects mechanical failure. While mechanical stresses are the primary cause of fracturing, chemical factors such as dissolution and stress-induced corrosion may also contribute to the formation process. The term "fracture" is often used when there is insufficient evidence to categorize the feature precisely or when distinguishing between fracture types is not critical. Building on this broad definition, the following discussion outlines the key types of natural fractures commonly encountered in subsurface formations relevant to the petroleum industry.
Classification of fractures: While a fracture is a broad term referring to any brittle break in rock, a fault is a more specific type of fracture involving measurable displacement. But why does this distinction matter? Is classifying fractures simply an academic concern?
In fact, using accurate fracture terminology has important practical implications:
| • | Fracture orientation reflects past stress conditions: Different fracture types form in characteristic orientations relative to the stress fields that were present during their formation. Proper classification helps in understanding the overall fracture system, which is crucial for planning optimal well trajectories and for developing accurate reservoir models | |
| • | Fractures differ in how they transmit fluids: Not all fractures conduct fluids in the same way. Identifying the fracture type helps in evaluating the permeability and flow behaviour within the reservoir | |
| • | Some fractures are restricted to specific geologic settings: Certain fracture types occur only in particular rock types or geologic environments. Recognizing them can provide insights into subsurface conditions | |
| • | Fracture types follow unique spatial patterns: Each fracture category may have distinct shapes, sizes, and spacing patterns that can be quantified and applied in constructing reliable 3D reservoir models |
The term “fracture” broadly refers to any type of brittle failure in rocks, while a “fault” is a more specific category of fracture characterized by noticeable displacement along the fracture surface. But does distinguishing between different types of fractures truly matter, or is it merely an academic exercise? In fact, accurately classifying fractures carries significant practical importance in the oil and gas industry for several key reasons:
| • | Various fracture types develop in distinct orientations relative to the stress fields present during their formation. Correct identification of fracture types is crucial for understanding and predicting the overall orientation of fracture networks, which is essential for planning optimal drilling trajectories and for constructing reliable reservoir models | |
| • | Different fractures exhibit varying capacities for fluid flow. Proper classification helps assess their potential as pathways or barriers to hydrocarbon movement | |
| • | Certain fractures are unique to specific lithologies or geological settings. Recognizing these relationships aids in predicting where similar fractures may occur elsewhere in the subsurface | |
| • | Specific fracture types tend to follow characteristic patterns in terms of shape, size distribution, and density (spacing). Understanding these patterns allows for more accurate construction of 3D reservoir models, which in turn improves resource estimation and recovery strategies |
Morphological classification of fractures
SFMI images reveal 1,640 fractures within the Asmari Formation: The 1,377 open and 263 closed. The closed fractures exhibit resistive or tight traces, while the open fractures are recognized by continuous or discontinuous conductive traces. These open fractures are distributed throughout the interval, with higher concentrations in certain zones.
Fractures were morphologically categorized into four types: Major open, medium open, minor open (continuous or discontinuous), and closed. Figure 10a provides structural dip and fracture header data from Zone 5, and Fig. 10b visually distinguishes fracture types-minor open fractures marked with blue triangles, medium open with blue circles, major open with blue squares, and closed fractures.
Continuous open fractures, showing uninterrupted traces across all pads, typically have larger apertures. Discontinuous open fractures, seen only on selected pads, often display segmented traces and vuggy textures (from dissolution processes typical in carbonates). Closed fractures are fully healed, generally surrounded by a resistive halo.
Among the open fractures, 24 are classified as major (wide aperture, continuous trace), while medium and minor fractures are narrower but still conductive. Minor open fractures dominate, totalling 1,224 cases, some featuring vuggy discontinuous traces, as highlighted in Fig. 10b.
Assessment of fracture geometry
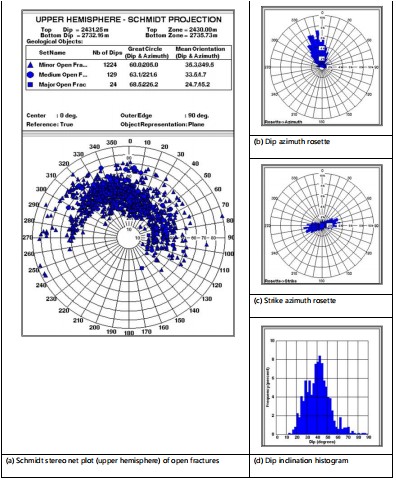
Dip and strike trends: Fractures predominantly cluster within the 20-60° dip inclination range, as shown in the Schmidt stereonet in Fig. 11a for open fractures and Fig. 12a for closed fractures. The average dip of open fractures is 43°, trending toward N7W, with a strike direction mainly between N83E-S83W. Figure 11b (dip azimuth rosette) and Fig. 11c (strike rosette) confirm these directional preferences for open fractures. The dip histogram in Fig. 11d further reinforces that most open fractures dip between 40 and 60°.
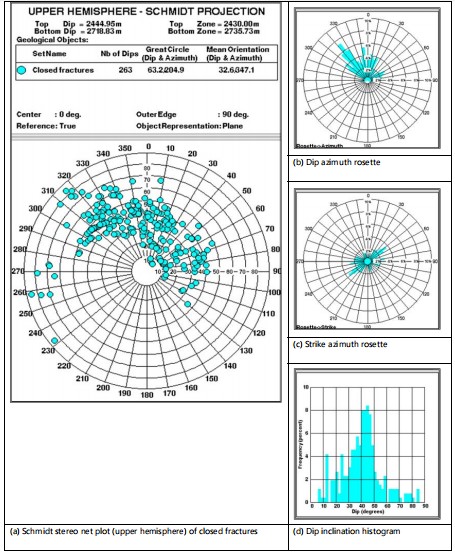
In contrast, closed fractures dip toward N15W and show a broader inclination range (10-86°), striking predominantly along N75E-S75W. These patterns are illustrated in Fig. 12a-b (dip azimuth rosette), Fig. 12c (strike rosette), and Fig. 12d (dip histogram).
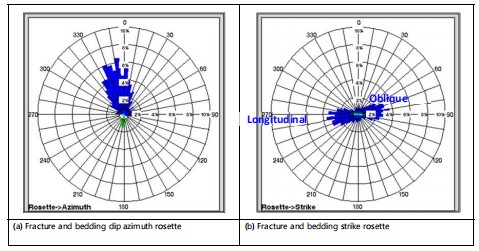
Comparison with bedding dip data reveals that open fractures strike nearly parallel to bedding planes, indicating a primarily longitudinal fracture system. Figure 13a shows the overlapping dip azimuth rosette of fractures and bedding planes, and Fig. 13b displays their strike alignment, both confirming the longitudinal character of the fractures in the Asmari Formation.
Distribution of fractures: A total of eleven distinct open fracture zones were identified within the examined interval of the Asmari Formation. These were delineated based on fracture density and spatial clustering of fractures observable on the sidewall formation micro imager (SFMI) log. Analysis of dip angle and azimuth rose diagrams indicates that the open fractures exhibit variable orientations across depth. This variation in fracture geometry and orientation may reflect the influence of nearby structural discontinuities, such as faults (Fig. 14a-b).
In contrast, closed fractures were observed in separate depth intervals, with notable clusters at approximately 2555-2578, 2595, 2615-2615.4, 2630.5, and 2703-2715 m. These intervals do not overlap with the open fracture zones, suggesting distinct mechanisms of fracture closure or diagenetic healing at varying depths. The spatial segregation of open versus closed fractures is clearly illustrated in the composite plot (Fig. 14).
|
Porosity characteristics of fracture networks: Fracture porosity was calculated using SFMI image analysis, based on the product of fracture length and aperture divided by the total borehole wall area captured. This method provides an effective estimation of fracture porosity (%), which varies across different fracture zones (Table 2).
For example, Zone 6, which contains the highest number of open fractures (697 fractures across 124 m), exhibits porosity values up to 0.013 m3/m3, suggesting high fracture intensity and larger aperture widths (Table 2, Fig. 14b). In contrast, Zone 4 shows significantly lower porosity values (0-0.001 m3/m3), with fewer fractures and narrower apertures. These variations across zones provide important insight into local heterogeneity in fracture development.
Measurement of fracture openings: Since closed fractures do not have open apertures, aperture measurements are not conducted for them. Aperture calculations are performed only on all categories of open fractures, excluding the possible fractures, to concentrate on higher-confidence data.
|
| Table 2: | Overview of fracture zone characteristics, primarily based on the average porosity within each interval | |||
| Zone | Zone width (m) |
Number of open fractures |
Fracture density (1/m) |
Fracture aperture (cm) |
Fracture porosity (m3/m3) |
Reference |
| 4 | 20 | -46 | 0-33 | 0.001-0.05 | 0-0.001 | Fig. 14 |
| 5 | 64 | -220 | 0-40 | 0.001-0.05 | 0-0.002 | Fig. 14 |
| 6 | 124 | -697 | 0-44 | 0.001-0.09 | 0-0.013 | Fig. 14 |
| 07-Jan | 64 | -242 | 0-35 | 0.001-0.06 | 0-0.003 | Fig. 14 |
| 07-Feb | 25 | -169 | 0-48 | 0.001-0.018 | 0-0.002 | Fig. 14 |
|
Aperture values are presented in centimetres within the composite display. The fracture aperture is determined using an equation developed based on modelling work conducted at the Schlumberger Research Center in France. According to this equation, the aperture (W) depends on the resistivity of the drilling mud (Rm) and the resistivity of the invaded formation zone (Rxo):
|
Where:
| W | = | Fracture aperture | |
| A | = | Current access flow through the SFMI/FMS electrode | |
| RmR_mRm | = | Drilling mud resistivity | |
| RxoR_{xo}Rxo | = | Resistivity of the invaded zone | |
| c and b | = | Constants derived from the model |
Overall, fracture aperture varies from 0.001 cm in many places to 0.1 cm around zone 6. Most fractures have an aperture near 0.01 cm (1 mm). Zone 6 and 7-1 has the highest fracture aperture (Fig. 14b, Table 2).
Petrophysical interpretation derived from image logs
High-resolution porosity: The accuracy of porosity analysis derived from image logs depends largely on selecting the right input parameters, which requires prior knowledge of the types and sizes of secondary pores. In this study, no core data were available for calibration, so the analysis was designed to cover the entire range of macro-secondary porosity within the Asmari Formation. High-resolution porosity results were generated at a fine sampling interval of 0.1 inches to capture detailed variations.
Traditional methods based on resistivity and porosity logs often struggle to reliably predict productive zones in carbonate reservoirs due to their complex dual-porosity systems. These reservoirs contain both primary porosity and secondary features such as vugs, moulds, fractures, and channels that conventional logs often miss because of limited resolution.
To overcome these limitations, borehole electrical imaging-especially Schlumberger’s SFMI-provides high-resolution, azimuthal coverage allowing detailed mapping of porosity variations around the borehole. The resistivity data from SFMI is transformed into porosity values by calibrating with shallow resistivity logs and effective porosity curves such as PIGE. Closed fractures are excluded from aperture calculations, and a uniform cementation factor of 2 is applied throughout the interval.
|
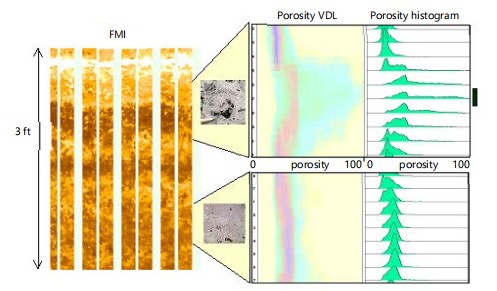
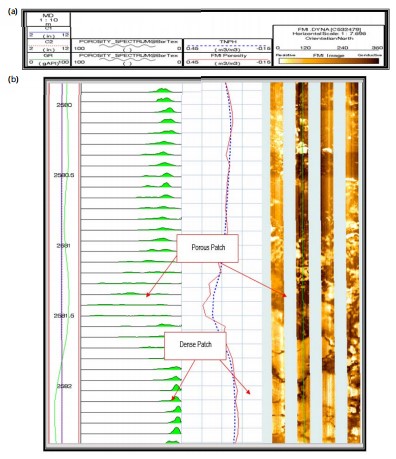
Using automated processing, porosity maps and histograms are generated over short intervals, providing continuous measurements of both primary and macro-secondary porosity. The histograms reveal different distribution patterns: Unimodal distributions correspond to homogeneous carbonate intervals, while skewed or multimodal patterns indicate heterogeneity caused by secondary porosity features. The high-porosity tail of these histograms corresponds to vugs and fractures, while the low-porosity end represents dense or cemented rock (Fig. 15a-b).
|
The average porosity from SFMI image logs is computed by averaging data from 96 porosity channels around the wellbore. This high-resolution porosity, output at 0.1-inch depth intervals, captures thin streaks and patches of both high and low porosity that conventional logs cannot resolve. In homogeneous zones, SFMI porosity closely matches neutron porosity measurements, while in heterogeneous zones with broader porosity distributions, SFMI porosity may be either higher or lower than the conventional log porosity (Fig. 16a-b).
Overall, porosity histograms indicate that much of the Asmari Formation is heterogeneous, showing wide porosity distributions, although some intervals exhibit narrow and predominantly unimodal porosity patterns. Comparison of image log porosity with effective log porosity demonstrates good agreement in homogeneous intervals and noticeable variations where complex porosity features such as vugs, fractures, and streaks are present (Fig. 17a-b).
In this study, the absence of core data for direct calibration imposes limitations on the absolute accuracy of porosity measurements derived from SFMI image logs. To mitigate this, the analysis was designed to encompass the full range of macro-secondary porosity variations expected within the Asmari Formation. Although core data was unavailable, cross-validation efforts involved comparing image-derived porosity with conventional neutron and density logs to verify consistency. Additionally, where available, regional seismic attributes and production test data were reviewed to qualitatively support the porosity trends identified, providing a more robust framework for interpretation despite data limitations.
Analysis of secondary porosity features: The reliability of secondary porosity interpretation in carbonate reservoirs strongly depends on the careful selection of input parameters, particularly when core data is unavailable, as in this study. To address this limitation, the analysis was designed to capture the full spectrum of macro-secondary porosity-including features such as vugs and moulds-within the Asmari Formation, using a high-resolution sampling interval of 0.1 inches.
In carbonate formations, conventional porosity and resistivity logs often fail to detect or quantify secondary porosity accurately due to the complex dual-porosity systems. These systems combine primary intergranular porosity with secondary features formed through diagenetic processes such as dissolution, which creates vugs, moulds, fractures, and channels. Traditional tools, limited by lower resolution, frequently underestimate these heterogeneities.
|
To overcome this challenge, borehole electrical imaging using Schlumberger’s SFMI technology provides high-resolution, azimuthal borehole coverage, enabling the precise detection and mapping of porosity variations. This method transforms resistivity images into porosity values by calibrating them against shallow resistivity measurements and effective porosity logs such as PIGE. Closed fractures are excluded from the analysis, and a uniform cementation factor of 2 is applied across the formation.
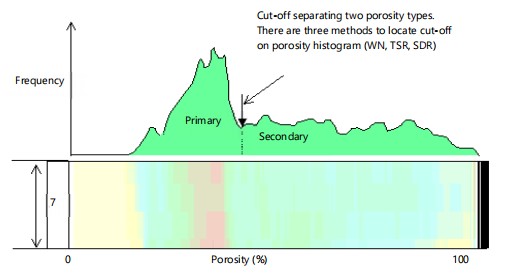
Porosity thresholding was applied to distinguish secondary (macro) porosity from primary matrix porosity. Three methods were used:
| • | WN threshold method: Defines a cut-off based on the standard deviation from the median porosity value, allowing dynamic adjustment based on porosity spread | |
| • | SDR (fixed-percentage) method: Sets a fixed percentage threshold above the mean porosity; this can be fine-tuned when core data is available | |
| • | TSR (statistical discriminant) method: An automated statistical approach that identifies the optimal separation point between porosity populations without manual input |
These methods enhance the ability to identify vugs, fractures, and other secondary porosity features that significantly affect reservoir quality. The results are then compared to conventional effective porosity logs for validation. In homogeneous rock intervals, the image-derived porosity aligns closely with log porosity, while in heterogeneous zones, significant variations reflect the influence of secondary porosity elements such as vugs and fractures (Fig. 17a-b).
|
The image logs obtained from the study will provide clear evidence of the presence of vugs and other diagenetic features that are characteristic of secondary porosity. This type of porosity most likely developed through dissolution processes that altered the original rock fabric. Within the analysed intervals, the extent of secondary porosity varies, ranging from negligible amounts (0%) up to around 10%. Notably, certain depth intervals exhibit a more significant presence of secondary porosity. These include
Zone 5, located between 2495 and 2500 m; Zone 6, covering depths of 2626-2630 and 2683-2685 m; Zone 7.1, spanning 2670-2694 m; and Zone 7.2, between 2722-2725 m. Intervals characterized by wider porosity distributions, as indicated by broader histograms, tend to reflect greater heterogeneity within the rock. Such heterogeneity corresponds to more variable and generally higher values of secondary porosity, suggesting localized zones of enhanced dissolution and pore space development (Fig. 18a-b).
Investigation of lithological and petrophysical variations: Reservoir heterogeneity analysis integrates borehole image logs with conventional open-hole logs to examine the internal structure and fabric of carbonate reservoirs. These reservoirs may display layered or massive characteristics, with porosity variations that include features such as vugs, moulds, karsts, channels, interparticle or intraparticle porosity patches, or porosity zones influenced by diagenetic alterations, bioturbation, or selective cementation. In Schlumberger’s SFMI images, dense or resistive zones-such as tight limestone or porous zones saturated with residual hydrocarbons-appear as light shades. Conversely, conductive zones, including shale layers, porous intervals invaded by mud, or areas with vugs and moulds, are represented by darker shades (Fig. 19a-b).
|
The primary driver of reservoir heterogeneity is the patchy distribution of porosity and permeability, which arises from diagenetic changes or shifts in lithofacies. For example, a reservoir comprising both grainstone and packstone can show contrasting flow properties: Grainstone may be tightly cemented and less permeable, while packstone retains better permeability. In bioclastic limestones, shell fragments appear as dense, resistive features, while dissolved or leached areas of the same shells are conductive and porous.
|
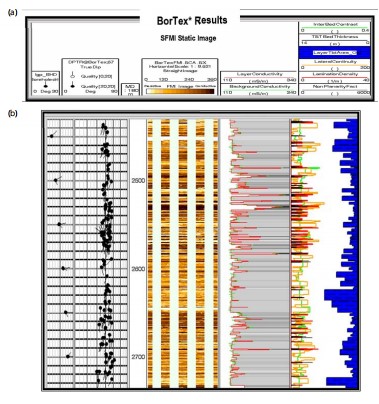
The heterogeneity within the Asmari Formation was characterized using BorTex software, which extracts lithological variations from SFMI images. Key heterogeneity types include:
| • | Resistive features: Dense, well-cemented zones (dark blue and cyan outlines) | |
| • | Conductive features: Porous intervals subdivided into large patches (dark magenta), connected spots (red), and isolated spots (orange) |
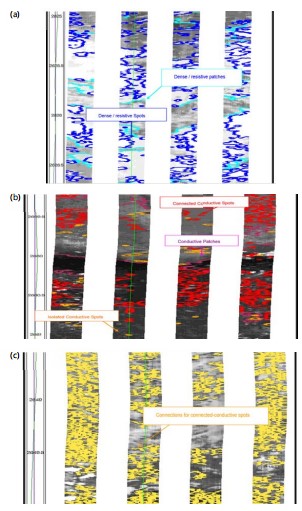
These features were quantified and represented as depth-referenced curves, providing a detailed spatial distribution of reservoir heterogeneity. Such quantitative data can be integrated into machine learning models for improved lithofacies prediction. The segmentation of resistive (blue, cyan outlines) and conductive (red, dark brown, and magenta spots) features is shown in Fig. 20a-b, while Fig. 20c illustrates interpreted connectivity paths via yellow connectors-highlighting zones of potential fluid flow.
|
In this study, the sidewall formation micro imager (SFMI) logs from Well RS-055 reveal significant variability within the Asmari Formation. Conductive anomalies observed in the image logs-indicative of porous intervals are associated with various features, including intergranular porosity, vugs, mouldicporosity, and natural fractures. In contrast, in denser rock intervals, conductive responses may correspond to the presence of clay-rich layers or seams. On the other hand, resistive anomalies typically represent compact, well-cemented strata where porosity is minimal or absent.
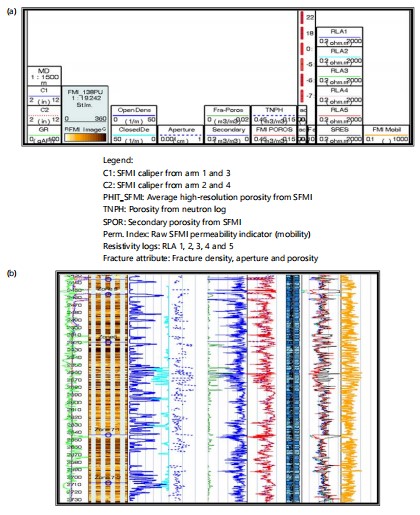
The distribution of heterogeneity within the Asmari Formation is uneven. Greater complexity and variability are particularly evident in the lower portion of Zone 5, the upper and central sections of Zone 6, the middle to lower parts of Zone 7.1, and the upper part of Zone 7.2. These zones display more diverse rock textures and pore systems, reflecting variations in depositional processes and subsequent diagenetic alterations. To improve lithofacies classification and better capture this complexity, five heterogeneity indices derived from Bortex analysis can be incorporated into advanced machine learning algorithms, such as neural networks. This integration allows for more accurate prediction and classification of lithological variations and reservoir quality across the formation (Fig. 21a-b).
SFMI-based permeability valuation: In addition to characterizing reservoir heterogeneity, schlumberger’s full-bore micro imager (SFMI) combined with BorTex software, was utilized to conduct a preliminary evaluation of the formation’s permeability. This assessment centres on analysing the connectivity between conductive features-such as conductive patches, isolated spots, and small-scale anomalies-captured in the image logs. These conductive elements are interpreted as potential micro-scale pathways for fluid movement within the rock matrix.
The conductive connections, which could represent possible routes for fluid flow, are visually highlighted as thin yellow lines on the SFMI images. A greater concentration of these conductive links generally suggests enhanced permeability potential (Fig. 21a-b), as they indicate increased fracture connectivity or the presence of interconnected pore spaces. The outcome of this analysis is expressed through a qualitative measure known as the “raw permeability index,” which provides a relative indication of permeability variations rather than exact numerical values.
In the current study, several intervals within the Asmari Formation-namely Zones 4, 5, 6, 7.1, and 7.2-demonstrated moderate to high raw permeability indices, with values exceeding 5 (as presented in (Table 3 , Fig. 21a-b). These zones are interpreted to have relatively better permeability characteristics compared to other sections of the formation. However, to establish a reliable absolute permeability profile for the Asmari reservoir in the Rag-e-Safid Field, it will be essential to integrate additional well data and perform calibration with direct permeability measurements. Such further analysis would help refine the understanding of the reservoir’s flow potential and support more accurate reservoir modelling.
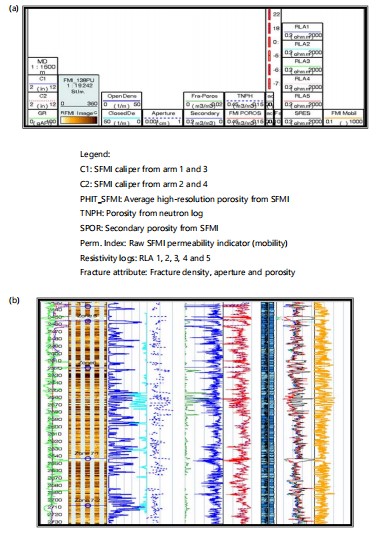
Impact of tar and heavy oil on petrophysical interpretation and reservoir quality assessment: The analysis of sidewall formation micro imager (SFMI) images alongside resistivity logs from the Asmari Formation has revealed notable discrepancies between shallow resistivity measurements (obtained via SFMI) and deeper resistivity readings (recorded through array tools such as RLA1 to RLA5). These inconsistencies are largely attributed to the presence of heavy oil and tar within the formation, which can artificially elevate resistivity values without reflecting actual fluid mobility or reservoir permeability. This phenomenon introduces significant challenges to accurate petrophysical interpretation and reservoir quality evaluation. A practical illustration of tar’s impact is presented in Fig. 21b, where the composite SFMI and resistivity logs reveal zones of elevated shallow resistivity caused by heavy oil saturation. Despite initial interpretations suggesting good reservoir potential, production data confirms poor flow-highlighting the misleading nature of resistivity in tar-bearing zones.
Influence of tar and heavy oil on resistivity measurements
Shallow SFMI resistivity: The SFMI tool measures resistivity very close to the borehole wall, within a shallow zone of investigation. In intervals containing heavy oil or tar, the resistivity recorded by SFMI is often abnormally high. This is primarily because tar and heavy hydrocarbons possess poor electrical conductivity, acting as insulators that raise the resistivity reading. However, these high resistivity values are misleading, as they do not reflect the actual capacity of the formation to transmit fluids.
Deeper RLA resistivity: In contrast, the deeper-sensing resistivity logs (RLA1-RLA5) measure electrical properties further into the formation, capturing a more representative picture of the formation fluids, including movable oil or water. These logs often display lower resistivity than the shallow SFMI logs in tar-affected zones, signaling the presence of more conductive fluids beyond the immediate borehole vicinity.
|
The divergence between shallow and deep resistivity profiles highlights the heterogeneous distribution of tar and its impact on electrical measurements.
Effects on permeability interpretation
Overestimation of permeability: High SFMI resistivity readings are frequently misinterpreted as indicators of high permeability. This is a common pitfall because the elevated resistivity is caused by the insulating effects of tar rather than by actual pore connectivity or fluid flow capability. Consequently, relying solely on resistivity may lead to an exaggerated estimation of the reservoir’s flow potential.
| Table 3: | Zones of raw permeability index and secondary porosity | |||
| Zone | Interval (m) | Porosity distribution | Secondary porosity | Raw permeability | Figure |
| 4 | 2436-2456 | Moderate heterogeneous With open fractures |
~0-9 | ~0-4 | Fig. 21 |
| 5 | 2456-2520 | Moderate to high heterogeneous With open fractures |
~0-10 | ~0-10 | Fig. 21 |
| 6 | 2520-2644 | Moderate to high heterogeneous With open fractures |
~0-10 | ~0-14 | Fig. 21 |
| 7-1 | 2644-2708 | Moderate to high heterogeneous With open fractures |
~0-12 | ~0-13 | Fig. 21 |
| 7-2 | 2708-2733 | Moderate heterogeneous With open fractures |
~0-10 | ~0-4 | Fig. 21 |
Reduction in effective permeability: Tar and heavy oil physically occupy pore spaces and often coat grain surfaces, reducing pore throat diameters and obstructing fluid pathways. Although porosity may appear significant, the effective permeability-the rock’s ability to transmit fluids-is substantially reduced in such intervals.
Challenges in porosity interpretation within carbonate and dolomite reservoirs
Elevated apparent porosity: In carbonates and dolomitic reservoirs, image logs and some porosity measurements may suggest high apparent porosity due to the presence of vugs and pore spaces. However, when these spaces are filled with immobile tar or viscous oil, they do not contribute to actual fluid flow. This leads to an overestimation of effective porosity.
Porosity-permeability mismatch: The assumption of a direct relationship between porosity and permeability does not hold in tar-impacted zones. High porosity may coexist with extremely low permeability, complicating reservoir performance predictions and masking the true production potential of the formation.
Complications in petrophysical interpretation
Disruption of conventional models: The presence of tar undermines traditional petrophysical models that link porosity and permeability. The usual correlations become unreliable, making it difficult to estimate reservoir properties based on standard interpretation techniques.
Complex formation evaluation: Tar saturation alters resistivity responses, making it challenging to distinguish between different types of hydrocarbons and fluid saturations. Relying solely on resistivity logs in such zones can result in misleading conclusions about the presence of movable oil versus immobile heavy hydrocarbons.
Recommendations for improved reservoir evaluation
Integrated multi-data approach: To enhance accuracy, SFMI image log data should be integrated with other datasets such as core analysis, well testing, and advanced logging tools like Nuclear Magnetic Resonance (NMR). This combined approach enables better discrimination between movable hydrocarbons and immobile tar.
Calibration of permeability models: Permeability models derived from image logs and resistivity data should be calibrated using laboratory-measured core permeability, especially in tar-affected intervals. Deeper resistivity logs should be used in conjunction with SFMI data to correct for shallow resistivity distortions caused by tar.
Explicit modelling of tar saturation: It is essential to include tar saturation explicitly as a parameter in reservoir simulation models. This allows for more accurate representations of how tar impacts porosity, permeability, and fluid flow, leading to better production forecasts and reservoir management decision.
DISCUSSION
The major findings of this study reveal that the Asmari reservoir in the Rag-e-Safid Field is highly heterogeneous, with fracture networks playing a significant role in controlling reservoir quality and fluid flow1. The dominant fractures dip at approximately 43° toward N7W, with strikes mainly trending N83E–S83W1. Additionally, the presence of tar-saturated zones complicates petrophysical interpretation by increasing resistivity measurements while reducing effective permeability . These results underscore the crucial importance of integrating detailed fracture characterization with multi-parameter petrophysical data to yield a more accurate assessment of reservoir performance6,8-10.
Current observations of fracture orientations and intensities align with those reported in previous studies of Mitra1 and Alavi5, which documented the controlling influence of fold accommodation faults and thrust-belt dynamics in the Zagros Fold-Thrust Belt. Similarly, the fracture complexity and fluid-flow implications correspond with earlier findings of Khoshbakht et al.2 and Nelson3, which emphasized the role of natural fractures in reservoir compartmentalization. The identification of tar zones concurs with reported challenges, where heavy hydrocarbons and fracture-fill cements interfere with resistivity-log interpretations in fractured carbonates. Our integrated approach, which combines FMI imaging and petrophysical logs, supports previous conclusions6-10, highlighting the necessity of multidisciplinary methods for accurate reservoir evaluation.
Despite these insights, the absence of core data in this well limits the quantitative calibration of fracture apertures and permeability estimates1, constraining direct validation of fracture connectivity and fluid-saturation models. This limitation underscores the need for future studies to incorporate core analysis, fluid sampling, and laboratory measurements . Additionally, the application of advanced techniques such as machine learning may further enhance lithofacies classification and heterogeneity prediction1. In summary, the intricate interplay between tectonic deformation, fracture networks, and tar saturation governs reservoir quality in the Asmari Formation1,4 and integrated high-resolution imaging coupled with multi-parameter petrophysical evaluation is essential for the effective characterization and management of such complex fractured carbonate reservoirs6,8-10.
CONCLUSION
The structural analysis of the Asmari Formation reveals a regional dip of about 44° toward S5W and extensive fracturing, dominated by discontinuous longitudinal fractures dipping ~43° toward N7W. High-resolution SFMI imaging, integrated with conventional logs, highlighted complex fracture networks, heterogeneous porosity (0-10%), and secondary features such as vugs and mouldic porosity, particularly in Zones 4, 5, 6, 7.1, and 7.2. These fracture-enhanced porosity–permeability zones, often exceeding raw permeability indices of 5, represent intervals of favorable reservoir quality. However, tar and heavy oil introduce interpretation challenges by elevating shallow resistivity and obscuring true reservoir potential, underscoring the need for multi-data integration. Advanced image analysis and machine learning approaches further improved facies and fracture classification, supporting robust reservoir modeling. Overall, the study confirms the Asmari Formation as a structurally complex carbonate reservoir where integrated high-resolution imaging and multidisciplinary interpretation are essential for accurate characterization and effective hydrocarbon recovery.
SIGNIFICANCE STATEMENT
This study provides new insights into the structural and petrophysical complexities of the Asmari Formation, highlighting how fracture-enhanced porosity and permeability influence reservoir quality in carbonate systems. By integrating high-resolution borehole imaging with conventional logs and advanced analytical tools, the research demonstrates effective strategies to overcome challenges posed by secondary porosity and tar saturation. These findings advance reservoir characterization approaches and support more reliable hydrocarbon recovery planning in structurally complex carbonate reservoirs.
REFERENCES
- Mitra, S., 2002. Fold-accommodation faults. AAPG Bull., 86: 671-693.
- Khoshbakht, F., H. Memarian and M. Mohammadnia, 2009. Comparison of Asmari, Pabdeh and Gurpi formation's fractures, derived from image log. J. Pet. Sci. Eng., 67: 65-74.
- Nelson, R.A., 2001. Geologic Analysis of Naturally Fractured Reservoirs. 2nd Edn., Gulf Professional Publishing, London, United Kingdom, ISBN: 978-0-88415-317-7, Pages: 332.
- Shariatinia, Z., M. Haghighi, S. Feiznia, D. Hall, G. Levresse, A.M. Dehghani and M. Rashidi, 2013. Paleofluid analysis from fracture-fill cements in the Asmari limestones of the Kuh-I-Mond field, SW Zagros, Iran. Arabian J. Geosci., 6: 2539-2556.
- Alavi, M., 2004. Regional stratigraphy of the Zagros fold-thrust belt of Iran and its proforeland evolution. Am. J. Sci., 304: 1-20.
- Movahed, Z., F. Aghajari and A.A. Movahed, 2023. Characterization of reservoir by using geological, reservoir and core data. J. Appl. Sci., 23: 34-46.
- Movahed, Z. and F. Aghajari, 2022. Analytical fractured reservoir characterization by using geological and petrophysical logs. Curr. Res. Geosci., 12: 11-28.
- Delleur, J.W., 2006. The Handbook of Groundwater Engineering. 2nd Edn., CRC Press, United States, ISBN-13: 978-0-8493-4316-2, Pages: 1320.
- Movahed, Z. and A.A. Movahed, 2023. Analytical methods to develop accurate structural model for the Asmari reservoir. Int. J. Chem. Eng. Mater., 2: 81-104.
- Movahed, Z., 2024. Evaluating the Asmari fractured reservoir: Findings from FMI and petrophysical logging. Asian Sci. Bull., 2: 480-508.
How to Cite this paper?
APA-7 Style
Movahed,
Z. (2025). Impact of Tar Saturation on Fracture Networks and Reservoir Quality: Integrated Structural and Petrophysical Analysis of the Asmari Formation. Asian Science Bulletin, 3(3), 224-253. https://doi.org/10.3923/asb.2025.224.253
ACS Style
Movahed,
Z. Impact of Tar Saturation on Fracture Networks and Reservoir Quality: Integrated Structural and Petrophysical Analysis of the Asmari Formation. Asian Sci. Bul 2025, 3, 224-253. https://doi.org/10.3923/asb.2025.224.253
AMA Style
Movahed
Z. Impact of Tar Saturation on Fracture Networks and Reservoir Quality: Integrated Structural and Petrophysical Analysis of the Asmari Formation. Asian Science Bulletin. 2025; 3(3): 224-253. https://doi.org/10.3923/asb.2025.224.253
Chicago/Turabian Style
Movahed, Zohreh.
2025. "Impact of Tar Saturation on Fracture Networks and Reservoir Quality: Integrated Structural and Petrophysical Analysis of the Asmari Formation" Asian Science Bulletin 3, no. 3: 224-253. https://doi.org/10.3923/asb.2025.224.253

This work is licensed under a Creative Commons Attribution 4.0 International License.